Engineering Economics
Christopher J. Collins
Chapter 2 — Engineering Economics
What an Engineering Change actually costs — and why the invoice is the smallest part of it.
Christopher J. Collins · Chapter Overview
Why cost is harder than it looks
Hours times loaded rate is a budgeting number. It is not an economic model.
Hidden every time:
authors idled while waiting on review
scarce specialists whose queue depth dwarfs their hourly rate
required approvals that add labor of minutes and delay of days
AI reviewers that cut authoring effort and raise verification effort
changes cheap to implement, expensive to coordinate
defects avoided — value real, evidence invisible
The right question is not "how much labor was recorded?" — it is what resources, what risks, what value, and what was displaced.
Four words to keep separate
Cost | resources consumed by the change or process |
Price | what you paid to acquire an input (may hide cost) |
Value | benefit created or protected by the outcome |
Investment | current cost incurred to raise future capability |
A process can get cheaper while destroying value. A change can be expensive and exceptional. A platform investment lowers throughput today to raise capacity tomorrow.
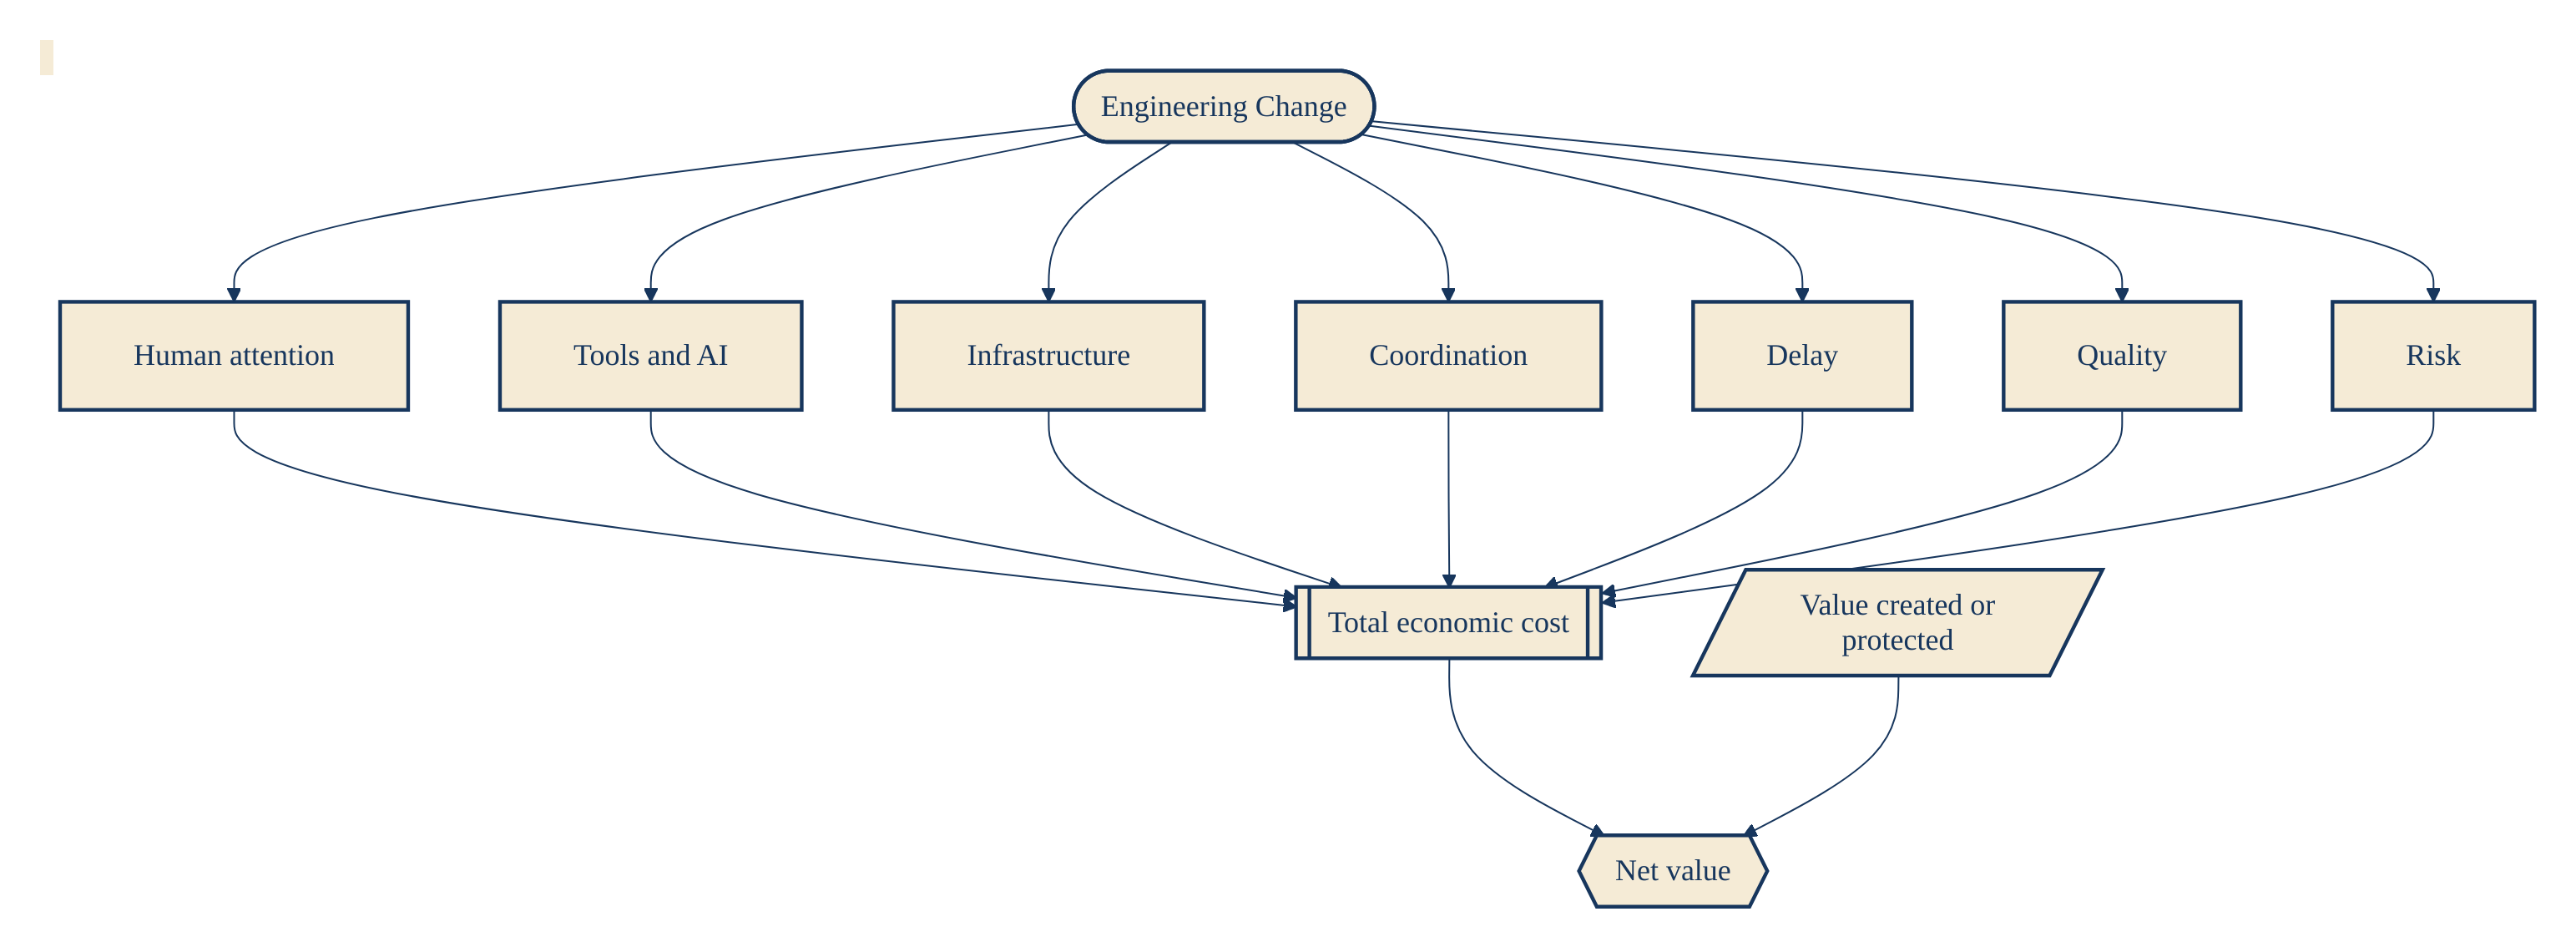
The total cost of an Engineering Change
additive for explanation — not independent in practice
a tool may cut authoring and raise quality
more review raises human cost and lowers expected defects
a slower rollout raises delay and reduces operational risk
A useful model records both the components and the assumptions connecting them.
The seven components
Human effort: three refinements
The naive estimate — hours \(\times\) loaded rate — is right for budgeting and wrong for decisions.
Active vs. elapsed — a PR open 40 hours did not consume 40 engineer-hours. Separate authoring, review, response, queue, and blocked time.
Attention-weighted — an hour from a single qualified crypto reviewer is not an hour from a broadly available contributor.
Context recovery — interruptions reload cost that appears nowhere in the timesheet.
False precision destroys trust. Report intervals, not 6.237 hours.
Attention scarcity
\(s_p\) is a scarcity multiplier, not a judgement of personal worth
estimated from queue depth, demand-to-capacity, time-to-assignment, count of qualified substitutes
if migration reviewers face 2x demand, their marginal attention constrains delivery more than their rate suggests
AI and tool cost — net, not gross
A cheap model producing many low-value comments can cost more than a costly model producing few trusted findings.
Cost per comment is rarely useful
Cost per validated defect prevented — meaningful
Cost per hour of quality-adjusted attention saved — meaningful
Capture marginal usage per change: tokens, passes, retries, cache hits, latency.
Coordination cost is nonlinear
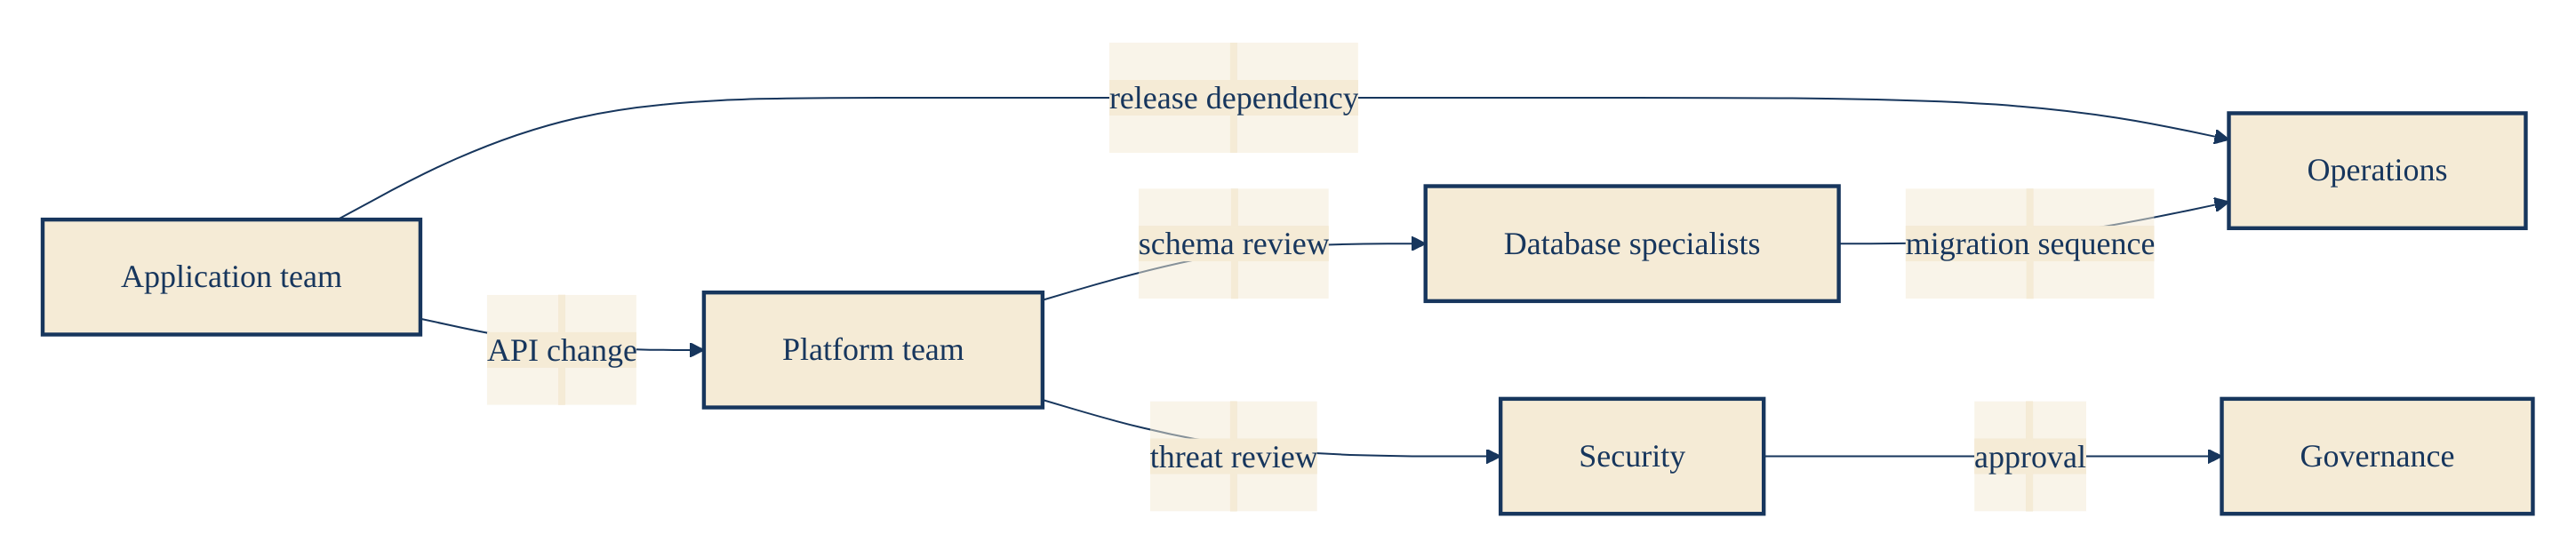
The pairwise communication paths among \(n\) participants:
Adding a second team is often cheap. Adding a fifth can be catastrophic. Ownership, interfaces, and boundaries are economic instruments.
Delay is not free
Report ranges — never fabricated precision.
Standard | value roughly linear in the relevant window |
Fixed date | value collapses after a deadline |
Expedite | incident-grade — delay is immediate and severe |
Exploratory | value is learning; delay postpones information |
Cost of delay is a prioritization aid — not a rhetorical device for manufacturing urgency.
Queueing: Little’s Law and the 70% wall
10 changes/week completed, 3-week flow time \(\Rightarrow\) ~30 in flight
WIP up without throughput up \(\Rightarrow\) flow time up
A review queue or CI cluster at 90% utilization is not "a bit slower" than one at 70% — it is qualitatively different. Small arrival-rate variance dominates the tail.
Carrying cost approximation: \(C_{carry}(e) = W_e \times k_e\).
Quality: prospective and retrospective
Expected loss makes trade-offs explicit:
Worked case. A $600 security review that reduces the probability of a $200,000 loss from 1.0% to 0.4%:
$1,200 of expected risk reduction for $600 of direct cost. Uncertain — but explicit.
Prevention · Appraisal · Internal failure · External failure. The objective is minimum total quality-adjusted cost.
Tail risk and the skew of cost
Averages mislead when the distribution is right-skewed and rare events dominate.
two changes with identical expected loss can carry very different catastrophic tail risk
historical averages under-price rare, severe outcomes
a policy tuned to the mean under-invests in the tail; tuned to the tail, it over-invests in routine
Regulatory violation is not made acceptable by a low expected-loss estimate. Report quantiles and CVaR, not just means.
Marginal vs. average — name the cost
Averages answer allocation questions. Marginal values answer change questions.
running one more test — marginal cost
comparing vendors — fully allocated cost
reducing capacity — avoidable cost
replacing a system — replacement cost
displaced alternatives — opportunity cost
Choosing the wrong cost category is a more common failure than computing incorrectly.
Ten minutes shaved off average review does not free ten minutes of usable capacity if the fragments are too dispersed to reallocate.
Uncertainty is the deliverable
Propagate it — don’t hide it. A credible decision report:
median annual net benefit: $650,000
80% credible interval: -$120,000 to $1.5M
P(net benefit > 0): 74%
most influential input: average cost of escaped defects
A single number is nearly indistinguishable from an educated guess. A distribution tells you which evidence would change the decision.
Common failure modes
Monetizing everything — forced dollars manufacture false certainty
Salary as value — compensation is an input price, not output
Ignoring displaced work — waiting and switching are assigned nowhere
Double counting — time saved, throughput, and cost of delay overlap
Optimizing components — cheaper CI can mean more failures
Ranking individuals — process-cost estimates corrupt when scored
Key takeaways
Total cost = human + tool + infra + coord + delay + quality + risk
Elapsed time is not labor time — queueing and recovery are separate
Value human attention by scarcity, not just loaded rate
AI economics must include validation burden and quality effects
Cost of delay connects flow to business impact — in ranges
Quality and risk are expected quantities, including failures prevented
Marginal, avoidable, and allocated costs are not interchangeable
Objective: maximum value under quality, risk, and human constraints — not minimum local cost
Next
Chapter 3 — Human Attention and Cognitive Load
Why attention is the binding constraint · intrinsic, representational, and coordination load · what "flow" actually costs when it breaks.