build: 2026-10-19 20:32 UTC

Measuring Engineering Systems


Chapter 5 — Measuring Engineering Systems

From telemetry to measurement: constructs, governance, and the discipline of a decision-relevant metric.

Christopher J. Collins · Chapter Overview

Telemetry is not measurement

Engineering organizations produce abundant telemetry. Most of it never changes a decision.

  • A dashboard that cannot change a decision is descriptive at best, distracting at worst

  • Every metric should trace to a stakeholder · action · threshold triad

  • Without that triad you have logs, not evidence

The purpose of measurement is to improve a decision.

The decision questions

Engineering Intelligence begins every metric with a question:

  • Should review capacity be added?

  • Is CI the dominant constraint?

  • Is an AI reviewer reducing total human effort?

  • Are changes becoming riskier after a workflow change?

  • Which repository boundaries create avoidable coordination cost?

A metric that cannot be traced to a question is telemetry, not measurement.

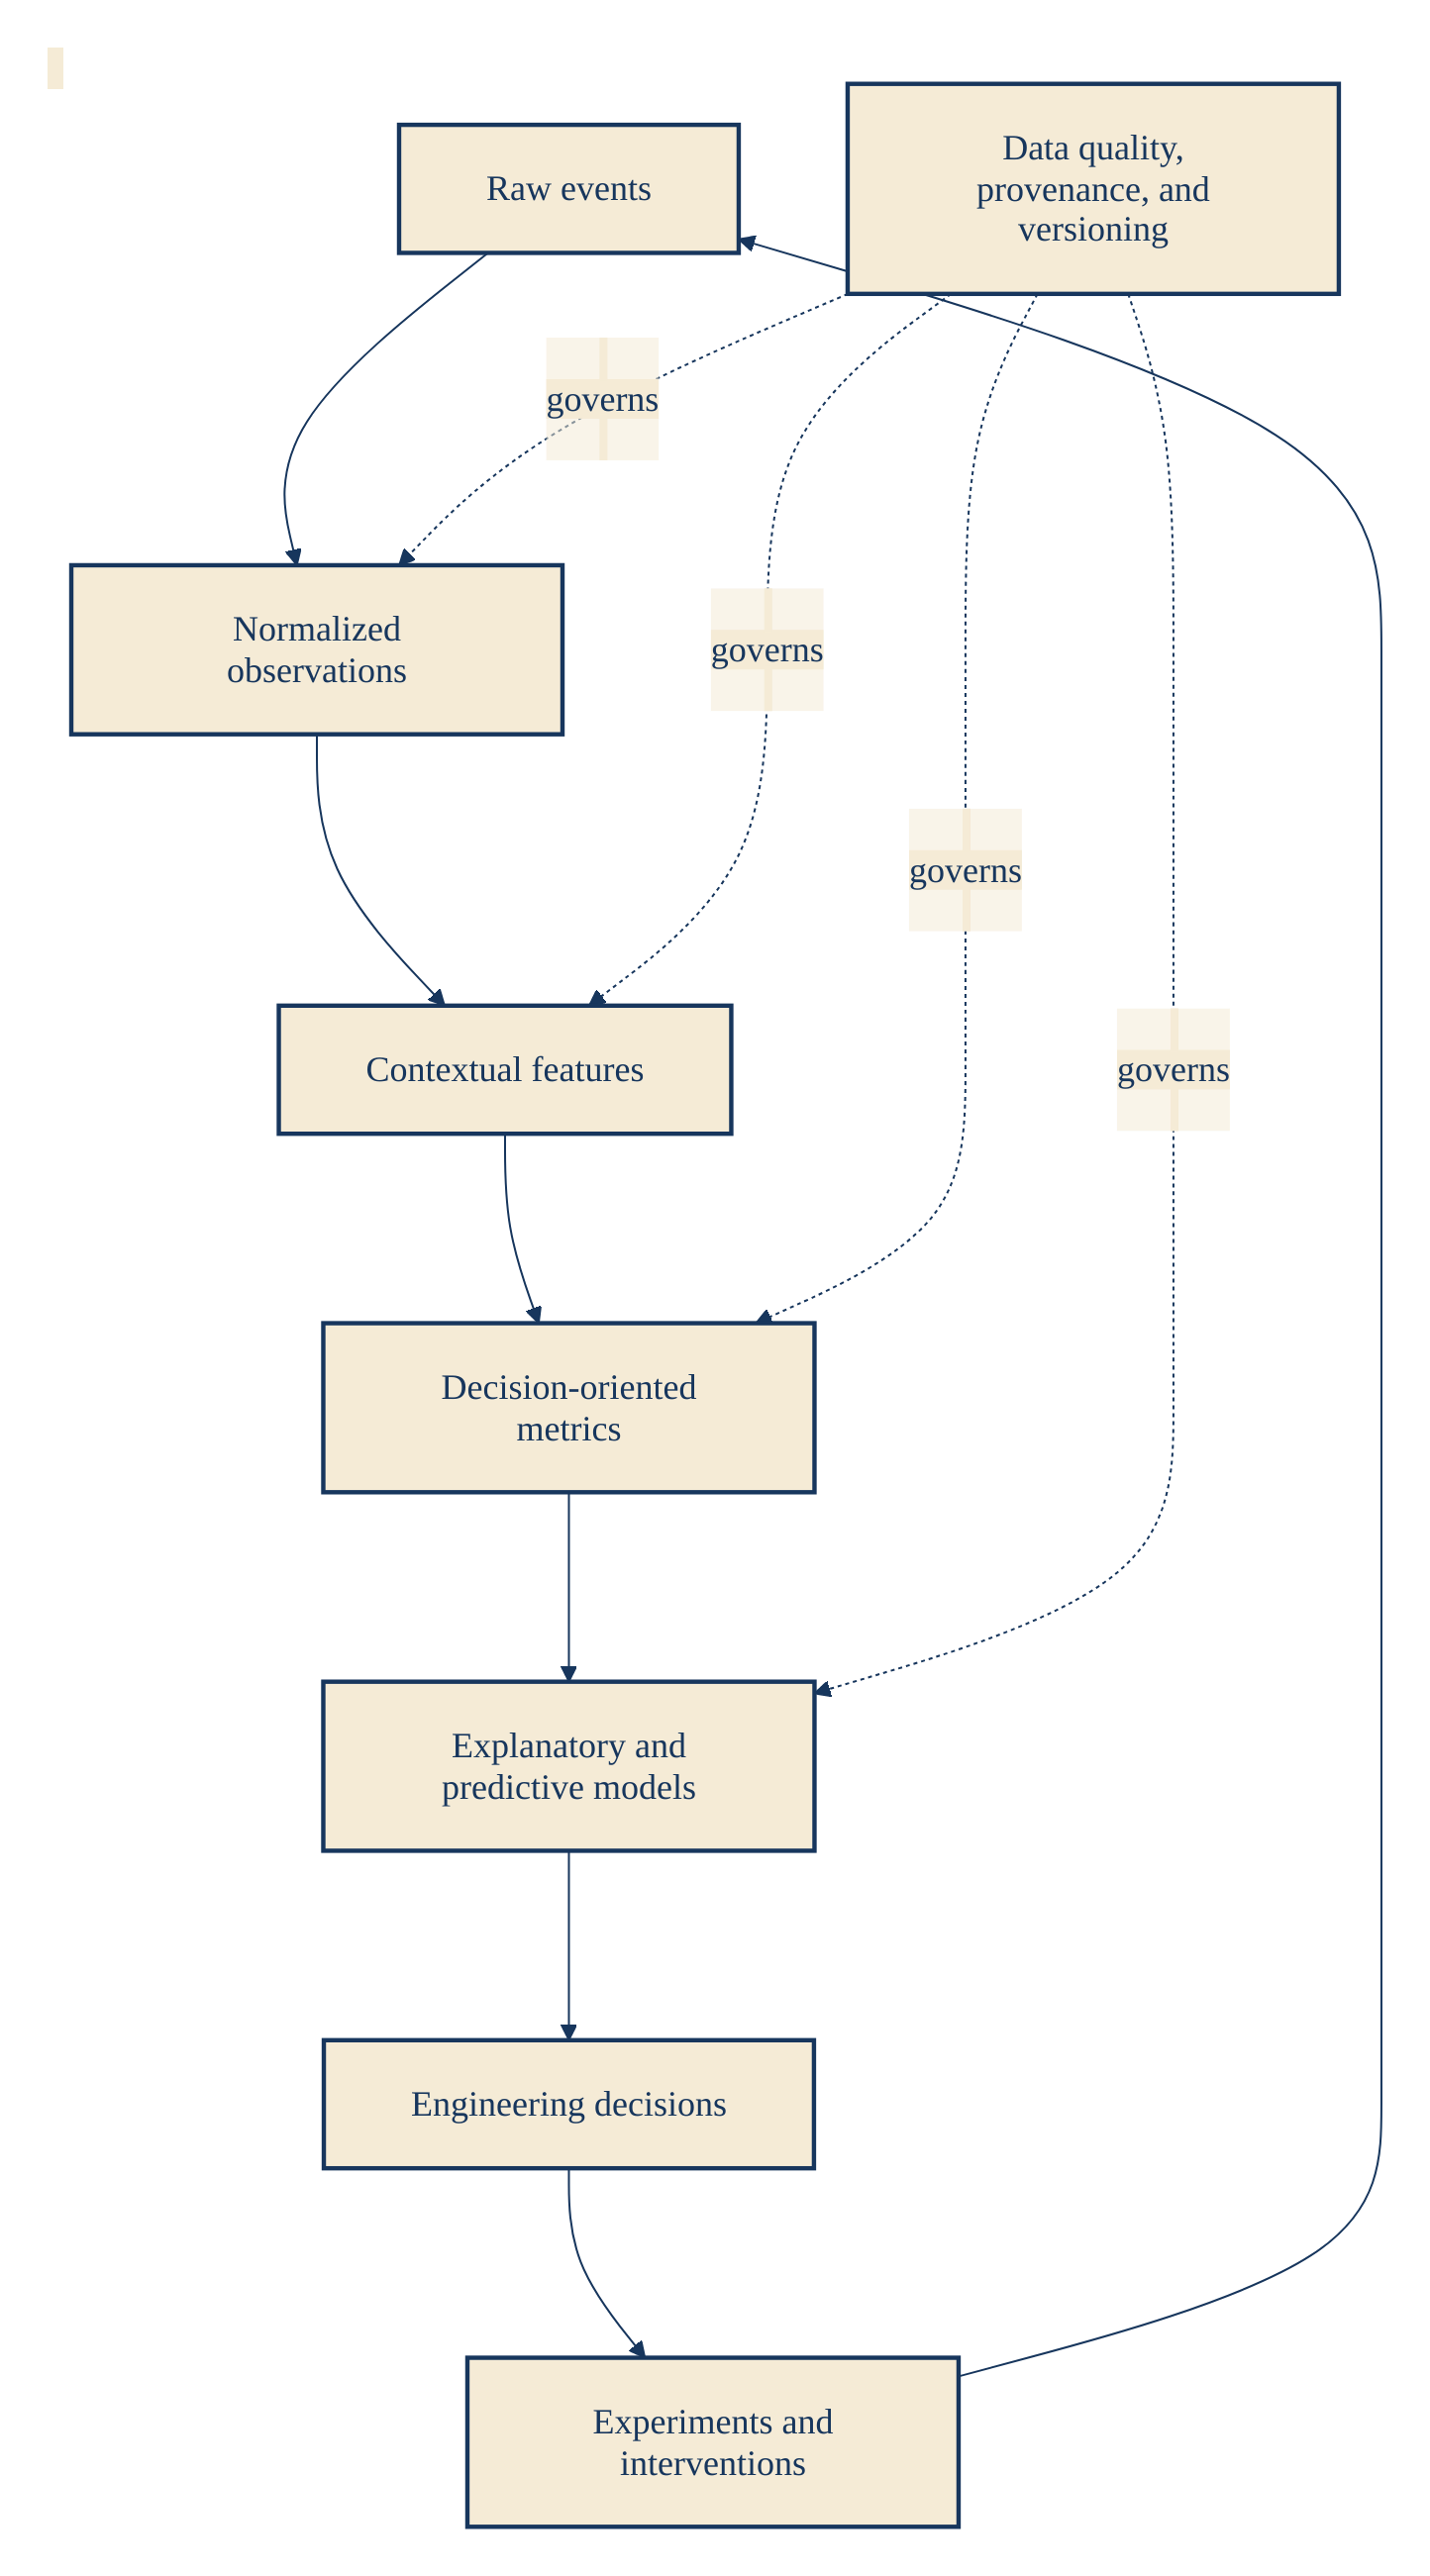
The measurement hierarchy

The measurement hierarchy
  1. Events — pull-request created, review submitted, CI completed

  2. Observations — normalized facts (time to first review, failed checks)

  3. Features — dependency depth, ownership boundaries, complexity

  4. Metrics — summarized quantities that answer a question

  5. Models — relationships to explain, predict, or counterfactually estimate

  6. Decisions — actions taken because of the evidence

A commit count is an observation. It becomes a metric only when attached to a construct and a decision.

Properties of a good metric

Decision relevance

Informs a specific choice

Construct validity

Measures what it claims

Reliability

Repeats under equivalent conditions

Sensitivity

Moves when the construct moves

Robustness

Resists gaming and workflow drift

Explainability

Users can drill to component evidence

Stability

Noise is quantified with intervals

Collection cost

Instrumentation earns its keep

Miss any of these and the metric is unfit for load-bearing decisions.

The metric taxonomy

Flow

lead time, active time, queue time, review latency, WIP

Quality

escaped defects, change-failure rate, rollback, rework

Economic

attention cost, AI cost, coordination cost, cost of delay

Human

context recovery, cognitive inventory, review burden

AI

precision, recall, duplication, offload, reload

Architecture

dependency depth, fan-out, blast radius, ownership

No category should be optimized independently. Faster flow with worse quality is not an improvement.

Direct vs derived metrics

Direct — computed closely from events: build duration, time to first review, deployment attempts.

Derived — depends on a model: cognitive burden, expected cost of delay, blast-radius score, Engineering Change complexity.

Derived metrics are often more decision-relevant, but require:

  • published definitions and model version

  • training data and calibration

  • confidence intervals and known limitations

  • validation evidence and recomputation history

Without this scaffolding a derived metric is a black box that quietly changes meaning.

Leading, lagging, local, system

Leading indicators change before the outcome:

  • review queue age, CI instability, dependency growth

Lagging indicators confirm realized outcomes:

  • incidents, escaped defects, customer impact

Local optimization can harm the system. Fewer CI tests cut compute — and raise rework. Lighter reviews shift burden to authors.

A strong scorecard pairs leading with lagging, and local with system-level.

Composite metrics with visible parts

A Review Friction Index combines normalized queue age, response cycles, unresolved comments, context-recovery events, and verification effort:

\[RFI(e) = \sum_{k=1}^{K} w_k z_k(e)\]
  • \(z_k\) are standardized components

  • \(w_k\) are calibrated — not chosen to make the answer look plausible

Users must be able to inspect component values. A composite that hides its parts is a slogan.

Guardrails on every optimization

Every optimization metric needs guardrails.

An AI-reviewer experiment may target lower human review effort while guarding against:

  • severe defect increase

  • rollback rate

  • security escapes

  • author misunderstanding

  • long-term reviewer disengagement

A change is beneficial only if the primary outcome improves and guardrails stay within predeclared tolerances.

Statistics for skewed, seasonal data

Engineering metrics are skewed, heavy-tailed, seasonal, clustered. Means alone are rarely sufficient.

  • median and selected quantiles

  • confidence or credible intervals

  • sample size and missingness

  • distribution plots, control limits

  • stratification by change class

  • hierarchical estimates for sparse groups

Control charts separate common-cause from exceptional variation. Bayesian updating supports direct statements about the probability of a meaningful improvement.

Metric versioning

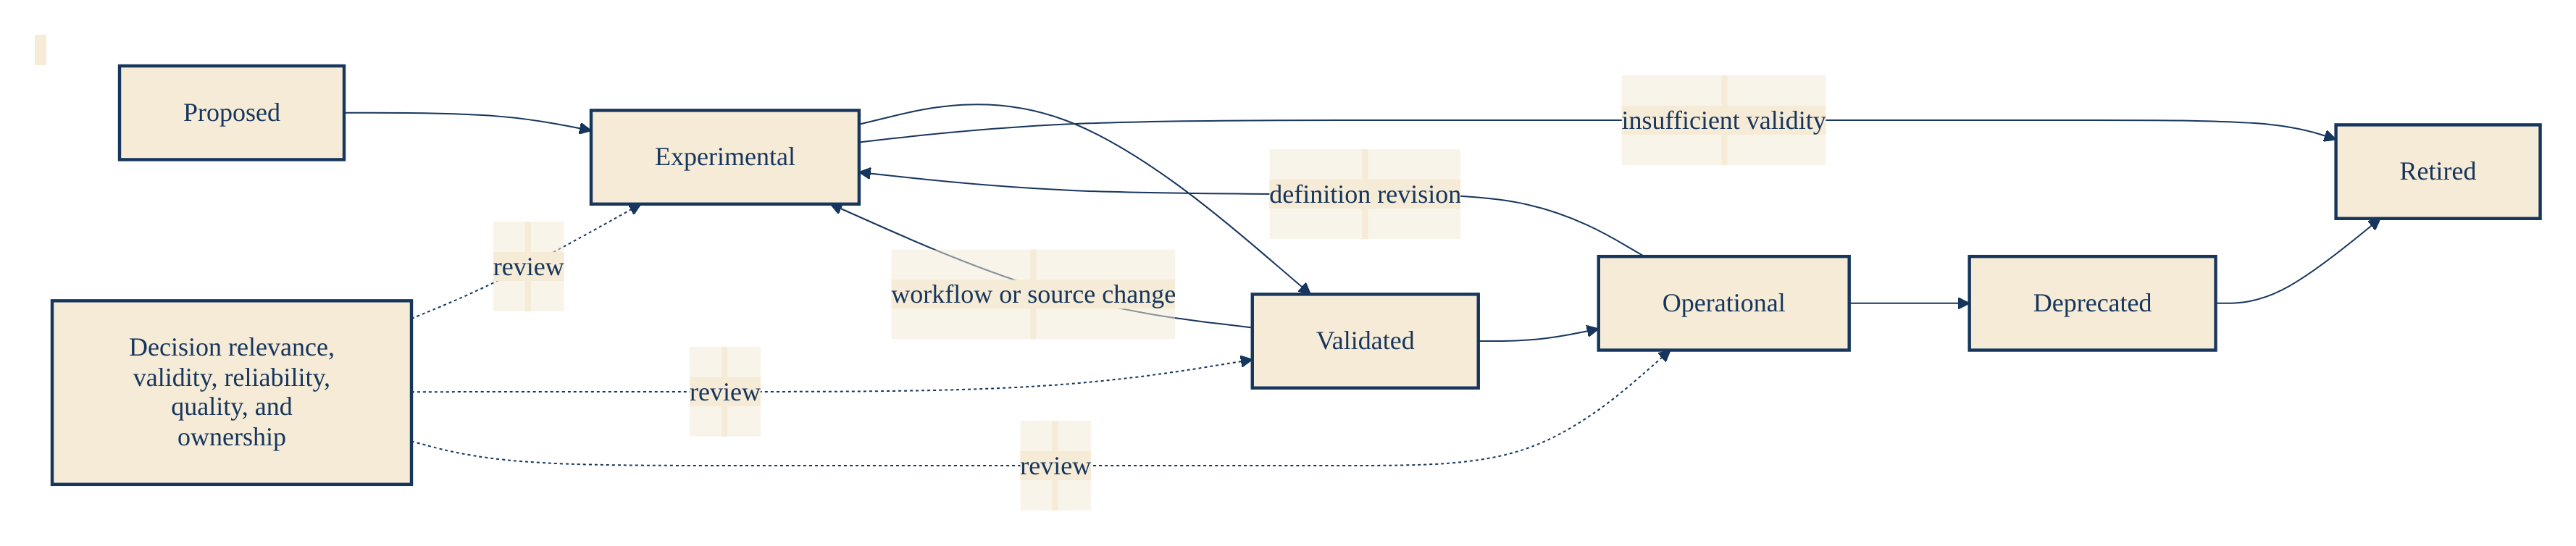
The metric lifecycle

A metric without a version is not reproducible evidence.

  • patch — corrects computation

  • minor — adds a compatible refinement

  • major — breaks historical comparability

Every material metric retains name, formula, source schemas, population, model version, computation time, and lineage to raw evidence.

Anti-patterns

  • Activity as productivity — commits, LOC, PR count are easy to game

  • Individual ranking — telemetry is confounded by assignment and invisible work

  • One universal score — hides trade-offs, invites Goodhart

  • Silent definition changes — invalidate history without warning

  • Correlation as causation — early adopters differ before adoption

  • Dashboard accumulation — every dashboard needs owner, audience, decision, review date

Worked example: unversioned metric change

Review latency drops from 8.4h to 5.9h in Q2 — a "30% improvement" credited to the new AI reviewer.

  • April: metric owner silently excluded drafts and bot-authored PRs

  • Recomputed under new definition, Q1 was really 6.7h, not 8.4

  • True improvement: 12%, not 30%

Expected annual net benefit falls from $650k to $95k. The AI-reviewer decision would have been reversed had the metric been governed properly.

A single unversioned change misdirected half a year of investment.

The metric specification

Name and version

Stable identifier for reproducibility

Decision

Question the metric informs

Construct

Concept being measured

Formula

Exact computation

Unit and population

Scope and denominator

Sources

Required events and entities

Latency

Real-time, daily, weekly, retrospective

Validation

Evidence of validity and reliability

Bias and gaming

Known failure modes

Guardrails

Outcomes that must not worsen

Owner

Accountability for definition and maintenance

Metric catalogues are governed products, not undocumented queries.

Key takeaways

  • Telemetry becomes measurement only when connected to a construct and a decision

  • Good metrics are relevant, valid, reliable, sensitive, robust, explainable, stable, and worth their cost

  • Flow, quality, economics, human, AI, architecture — evaluated together, not in isolation

  • Derived metrics need model governance, versioning, uncertainty, and validation

  • Every optimization needs guardrails; every comparison needs normalization

  • Metric catalogues are governed products with owners and retirement dates

Next

Chapter 6 — Instrumentation and Data Architecture

Schemas, identity resolution, event streams, knowledge graphs, and the governance plane that keeps a metric catalogue trustworthy.