Portfolio and Executive Decision-Making
Christopher J. Collins
Chapter 14 — Portfolio and Executive Decision-Making
How change-level evidence supports allocation decisions without collapsing engineering into a single score.
Christopher J. Collins · Chapter Overview
From measurement to allocation
Engineering Intelligence exists to improve choices about money, attention, time, and risk capacity.
Allocation decisions it should inform:
which initiatives receive scarce capacity
where specialist review bandwidth is added
which platform investment reduces the largest recurring cost
whether to buy, build, replace, or retire a tool
which migrations to accelerate because delay is expensive
where risk should be accepted, reduced, transferred, or avoided
The objective is not maximum throughput. It is maximum expected value under constraints.
The portfolio value model
For an Engineering Change \(e\), define expected net value:
Selection under constraints:
Real portfolios add dependencies, mandatory work, correlated risks, staged decisions, and uncertain outcomes.
Capacity is multidimensional
Headcount is not one interchangeable pool.
general implementation effort
specialist domain expertise
review and approval bandwidth
platform and infrastructure capacity
deployment windows and test environments
leadership attention
change absorption in customers and operations
A plan fully funded in engineer-months can still be infeasible if one scarce expertise pool is overcommitted.
Opportunity cost
The cost of choosing one initiative includes the value of the best alternative displaced.
If a security migration consumes the only database specialists for a quarter, the comparison is not just its direct cost — it is the value of everything else delayed by that constraint.
Made visible through queueing, dependency, cost-of-delay, and scarce-attention models.
Mandatory work is a constraint, not a rank
Not all work is selected by ROI.
regulatory commitments
critical security remediation
contractual obligations
safety and financial-integrity controls
end-of-life migrations
incident recovery
Represent these as floors and constraints, not as artificial financial benefits stuffed into a ranking.
Option and information value
An investment can create the right, but not the obligation, to pursue future opportunities — reusable platforms, removed vendor lock-in, clean data boundaries, observability before a migration, prototypes that resolve uncertainty.
Expected value of information:
A small experiment can be valuable because it prevents a much larger mistaken commitment.
Dependency-aware portfolios
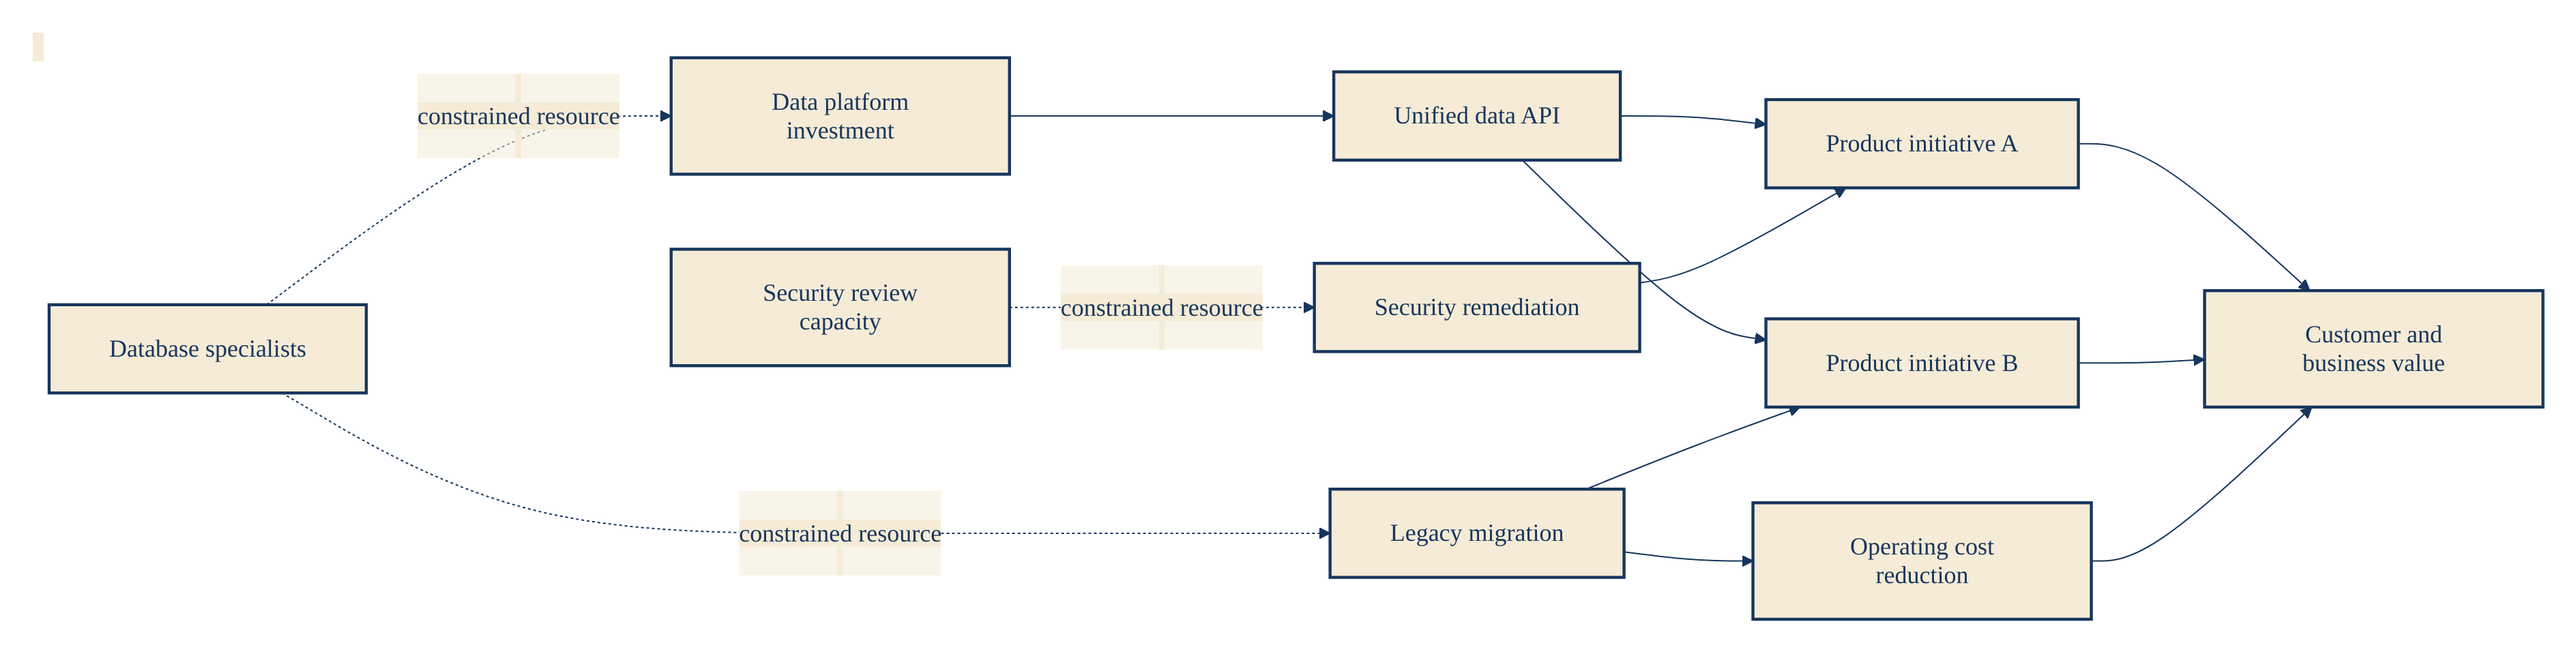
Initiatives are not independent. Represent the portfolio as a graph with edges: ENABLES, BLOCKS, REQUIRES, COMPETES_FOR, REDUCES_RISK_OF.
Useful measures: prerequisite depth · enabled value · shared bottlenecks · critical portfolio path.
Cost of delay and WSJF
Different work has different delay-cost shapes: regulatory deadlines, seasonal launches, incident remediation, internal refactors.
A heuristic, not a universal truth. Adjust for dependencies, uncertainty, risk, and scarce-resource constraints.
Uncertainty, scenarios, simulation
Executives should not rely on expected values alone.
For each initiative report: median, credible interval, downside/upside, probability of negative NV, reversibility, key uncertainty drivers.
Scenario planning identifies decisions robust across several plausible futures — demand, regulation, vendor pricing, AI cost, attrition.
Monte Carlo simulation samples cost, duration, benefit, and dependency outcomes to estimate probability of meeting commitments and bottleneck frequency.
Executive scorecards
| View | Question |
|---|---|
Portfolio flow | Where is value delayed and why? |
Capacity constraints | Which expertise, review, or deployment resources bind? |
Quality and risk | Where is expected failure loss concentrated? |
Engineering economics | Where is money and attention consumed vs. value created? |
Experiment evidence | Which interventions have shown causal benefit? |
Platform health | Can the measurement system itself be trusted? |
Each view exposes uncertainty, work mix, and drill-down.
Avoiding the one-score trap
Combining flow, cost, quality, cognition, and value into one enterprise score creates fragile assumptions and gaming opportunities.
Show trade-offs and constraints, not a fabricated single ranking.
Composite scores may serve narrow routing decisions — only when components, weights, and policy are explicit.
Worked example — three initiatives, one bottleneck
42 general + 6 specialist engineer-quarters. Three candidates:
A — Payments migration. $8M value, 24+3 quarters, $180k/mo delay cost.
B — Developer platform upgrade. $4M value, 30+0 quarters, $60k/mo delay cost.
C — Regulatory program. Mandatory. 18+5 quarters. Missing the date = $12M penalty.
C is a floor, not a choice. A’s monthly delay cost is the price of unlocking C — legible, not hidden inside a composite score.
Common failure modes
Ranking by ROI alone — mandatory, option, risk, and dependency ignored
Treating capacity as fungible — nominal headcount hides scarce expertise
Double counting value — savings, throughput, and delay reduction overlap
Ignoring uncertainty — single forecasts create brittle commitments
Portfolio theater — scores produced after allocation is already fixed
Punishing forecast error — teams hide uncertainty and estimate politically
Decisions as durable artifacts
Preserve for each material decision:
alternatives considered
expected value and cost distributions
constraints, dependencies, assumptions
evidence and experiment results
dissenting views
selected option, review date, trigger conditions
Calibrate forecasts against realized outcomes — to improve models, not to punish uncertainty.
Key takeaways
Portfolio decisions allocate multiple constrained resources, not just headcount
Opportunity cost and cost of delay connect flow to strategic value
Mandatory work, option value, and learning value do not belong inside an ROI ranking
Dependencies and shared bottlenecks require graph-aware analysis
Use distributions, scenarios, and risk constraints — not point forecasts
Executive scorecards preserve trade-offs; avoid the universal score
Decision records and calibration turn allocation into organizational learning
Next
Chapter 15 — Implementation Roadmap
From framework to practice · staged adoption · governed metrics · the ninety-day starting move.