Christopher J. Collins

Engineering Intelligence

A Quantitative Framework for Measuring, Understanding, and Optimizing Modern Software Engineering
Christopher J. Collins · Executive Summary
Engineering organisations are richly instrumented but poorly understood
Dashboards proliferate; decisions don’t get better
Every leader has "the number" — nobody agrees on what it means
AI has raised the stakes without providing an answer to "is it helping?"
Engineering Intelligence is a discipline that answers those questions with evidence, not opinion.
What does an Engineering Change actually cost?
Where is scarce human attention consumed?
Which review activities prevent defects, and which merely add delay?
Does an AI-assisted workflow genuinely improve outcomes?
Which portfolio investment reduces the most system risk per dollar?
Software engineering is a measurable socio-technical system. Its performance can be modeled, measured, and improved — but only if we treat evidence, inference, and decision as separable objects with explicit governance.
The pull request is a platform artifact. It is not the unit of engineering work.
One capability = many pull requests, deployments, approvals, feature flags
One pull request may contain unrelated intents
Reconstructing the Engineering Change is the first step to any credible metric
Delay is not linear in load — it explodes near saturation.

Managing utilisation is a first-class economic problem, not a scheduling detail.
Compute can be provisioned. Attention cannot.
Cognitive load is multidimensional: intrinsic, representational, navigational, coordination, temporal, verification, tool interaction.
An 8-person team paying 3.4 context-switches × 12 min × 230 days ≈ $174k/year of pure recovery overhead.
A modest consolidation intervention saves $73k/year — an economic argument, not a preference.
Events | pull-request created, review submitted, deployment recorded |
Observations | normalised facts derived from events |
Features | explanatory variables (dependency depth, ownership boundary) |
Metrics | summarised quantities that answer a decision question |
Models | relationships used to explain, predict, or counterfactually estimate |
Decisions | actions taken because of the evidence |
Confusing these layers is the leading cause of dashboard proliferation.
Ties to a decision
Measures the construct it claims to measure
Is reliable, sensitive, robust
Has governance: version, uncertainty, owner, guardrails
Has a documented retirement criterion
Metrics without decision, owner, or retirement accumulate cost while adding noise.
Before-and-after averages mislead. The DAG makes assumptions explicit.
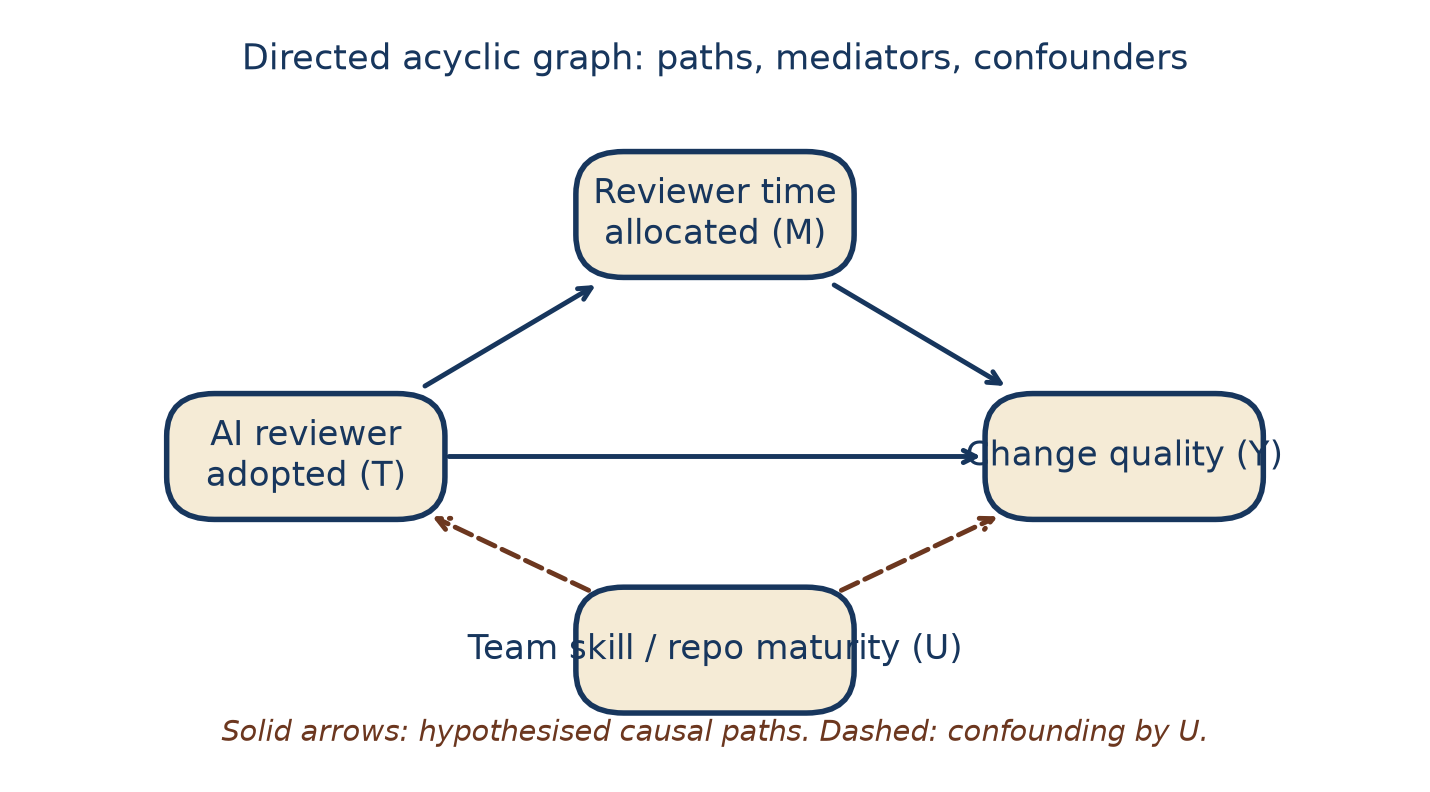
Randomisation cuts the confounding path. Adjustment blocks it. Neither happens by accident.
Analysis | Estimate | Says what | Right for |
Naive before-after | −1.9h | Least reliable | Nothing serious |
Difference-in-differences | −1.1h | Effect of offering the tool | Mandate decisions |
Complier-average (CACE) | −1.55h | Effect among users | Voluntary adoption |
Reporting the wrong estimand mis-prices the rollout.
AI creates cognitive offload AND cognitive reload.
Net Cognitive Effect: \(NCE = W_{offload} - W_{reload}\)
Quality-adjusted: multiply by retention factor to catch quality regression
An AI reviewer can save 3.3 min direct review time while adding 2.9 min of triage and rework — net 0.4 min saved, not the headline 19%
Number of downstream services affected
Fraction that are customer-facing
Difficulty of coordinated rollback
A 38-line "small" change can score in the top quartile of blast radius. The point of the score is not to block — it is to select the right rollout playbook.

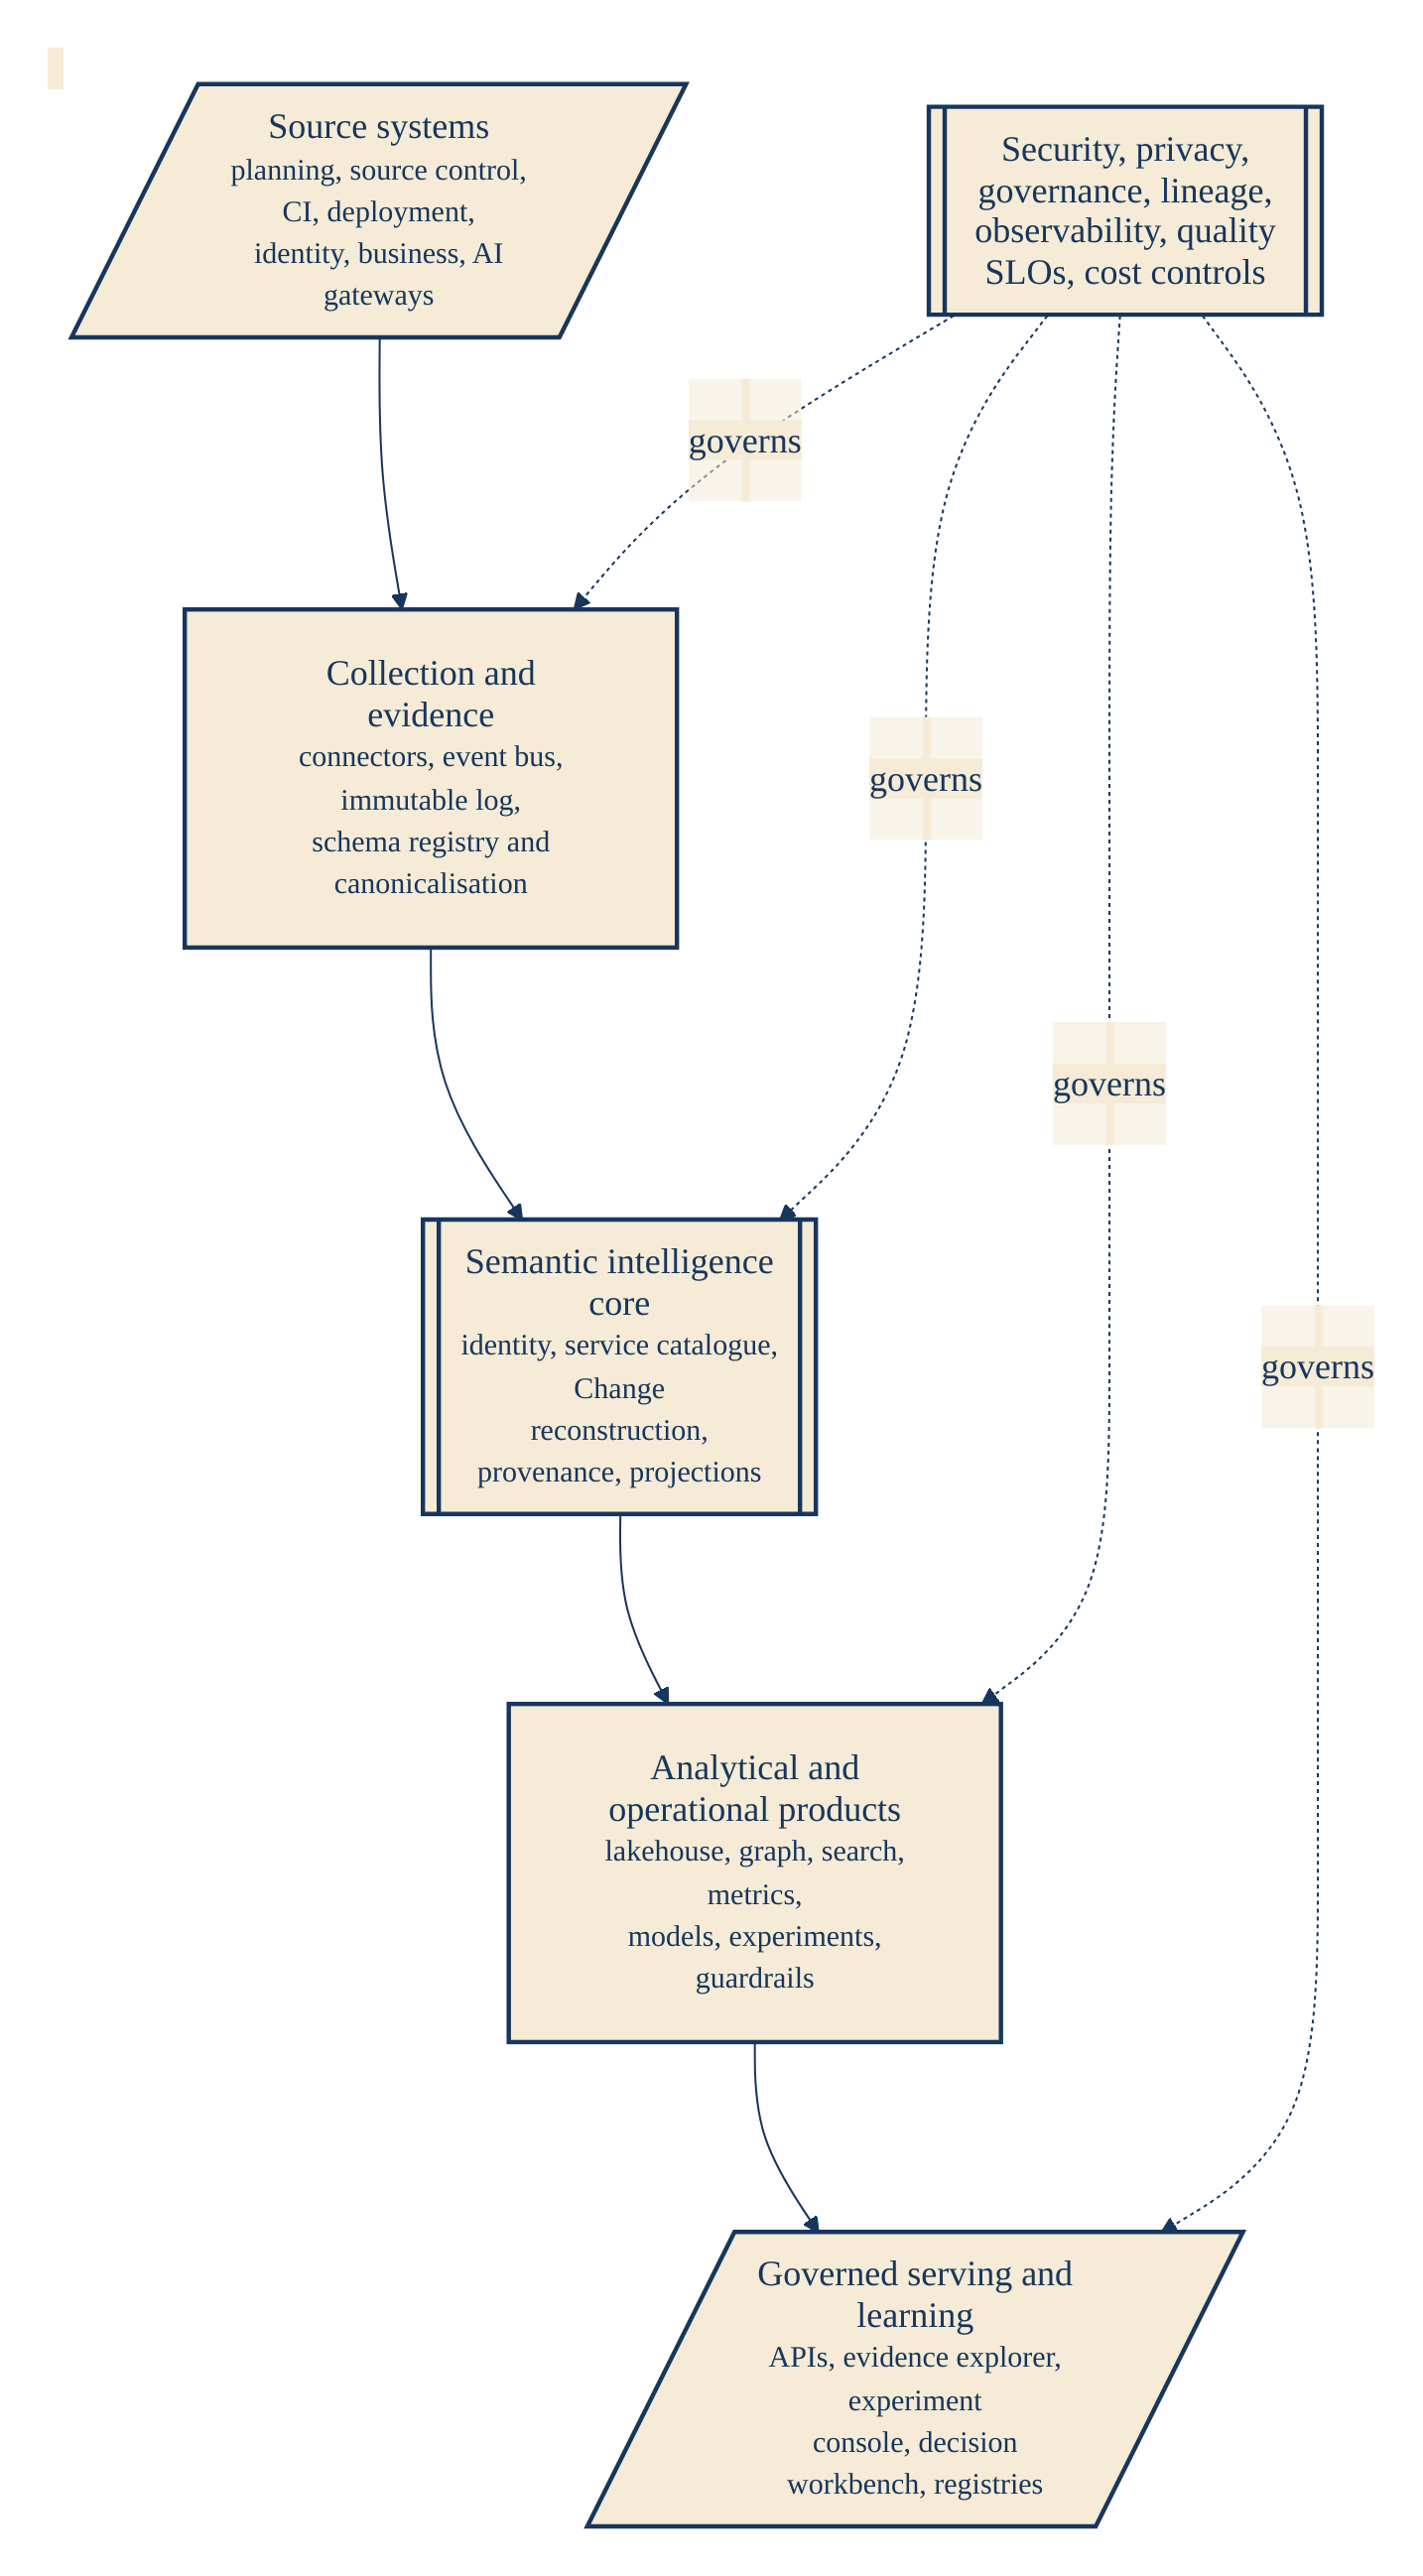
Five layers, one governance plane. Vendor-neutral; the durable value is in semantics, not tools.
Every use is classified 0–4 by consequence and sensitivity.
Class | Example | Review body |
0 | Platform operations | Lightweight |
1 | Team retrospectives | Lightweight |
2 | Portfolio decisions | Standard |
3 | Policy influence | Standard |
4 | Individual consequence | Full governance board (usually prohibited) |
Misclassification is more common — and more dangerous — than the wrong statistical test.
Three initiatives compete for 42 general + 6 specialist engineer-quarters.
Initiative A: $8M value, 24+3 quarters
Initiative B: $4M value, 30+0 quarters
Initiative C: Regulatory — mandatory, 18+5 quarters, deadline hard
C is a floor, not a choice. A’s monthly cost of delay is the price of unlocking C.
That trade-off is legible when reported as a bundle, invisible under an ROI score.

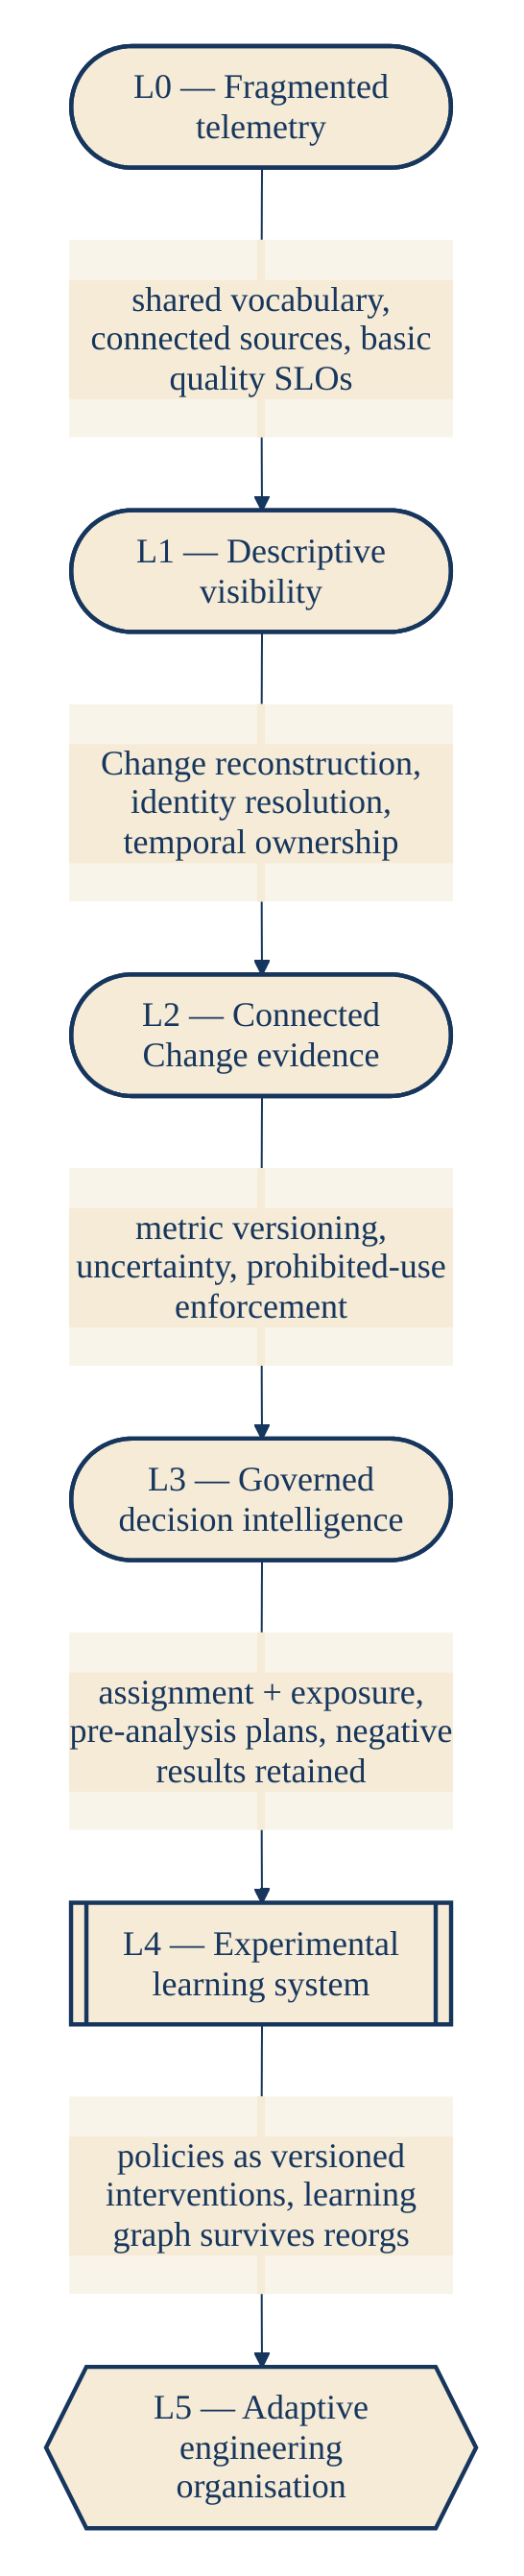
Every level closes a specific gap. Progress is measured in capability gained, not tools bought.
Start with:
One consequential decision — not universal instrumentation
Ingest sources for that decision only
Build governed metric v1.0 with uncertainty and guardrails
Register the use and its expected action
Iterate; publish negative results alongside positive ones
Ninety days. Not two years.
Every executive metric has a decision owner and a review date
Analyses cite a metric version
AI adoption produces both a QCOI number and a guardrail report
Individual engineers are never ranked by system telemetry
Retrospectives show the ratio of decisions changed by evidence rising quarter-over-quarter
Treat engineering as a science of its own — measure the system, not the artefact; govern the metric, not just the model; and invest where evidence, not fashion, says the constraint lies.
Read the book · Run the notebooks · Adopt at your own pace
Book: download.pdf
Notebooks: companion/notebooks/
Synthetic telemetry: companion/synth/