build: 2026-10-19 20:32 UTC

Bundling Metrics for a Decision


Bundling Metrics for a Decision

A hands-on workshop derived from Chapter 11 of Engineering Intelligence.

90 minutes · 4 hands-on segments

Learning outcomes

After this workshop you can:

  • Pick one decision and write it in a single sentence

  • Assemble a small metric bundle — primary · diagnostics · guardrails

  • Cover the five families: flow · quality · cost · attention · guardrails

  • Spot single-score traps and pre-empt Goodhart drift

  • Give every metric an owner, a population, and a retirement date

The problem

Your CTO asks: "are we improving?"

The answer comes back as a scoreboard of forty metrics. No owner. No decision attached. No idea which movements matter.

By month three, three metrics are being gamed. By month six, the scoreboard is quietly ignored.

A dashboard is not a decision. A metric without a decision is noise that accumulates cost.

What you leave with

Each pair leaves with one metric bundle for one decision:

  • one primary outcome metric

  • three to five diagnostics, one per family

  • two or three guardrails with declared tolerances

  • named populations and exclusions

  • an owner and a retirement date

Not a dashboard. A decision instrument.

A bundle, not a score

A composite that hides its components invites gaming. A number without its data-quality state is a rumour.

Consume metrics together. Expose components. Prohibit the single averaged score.
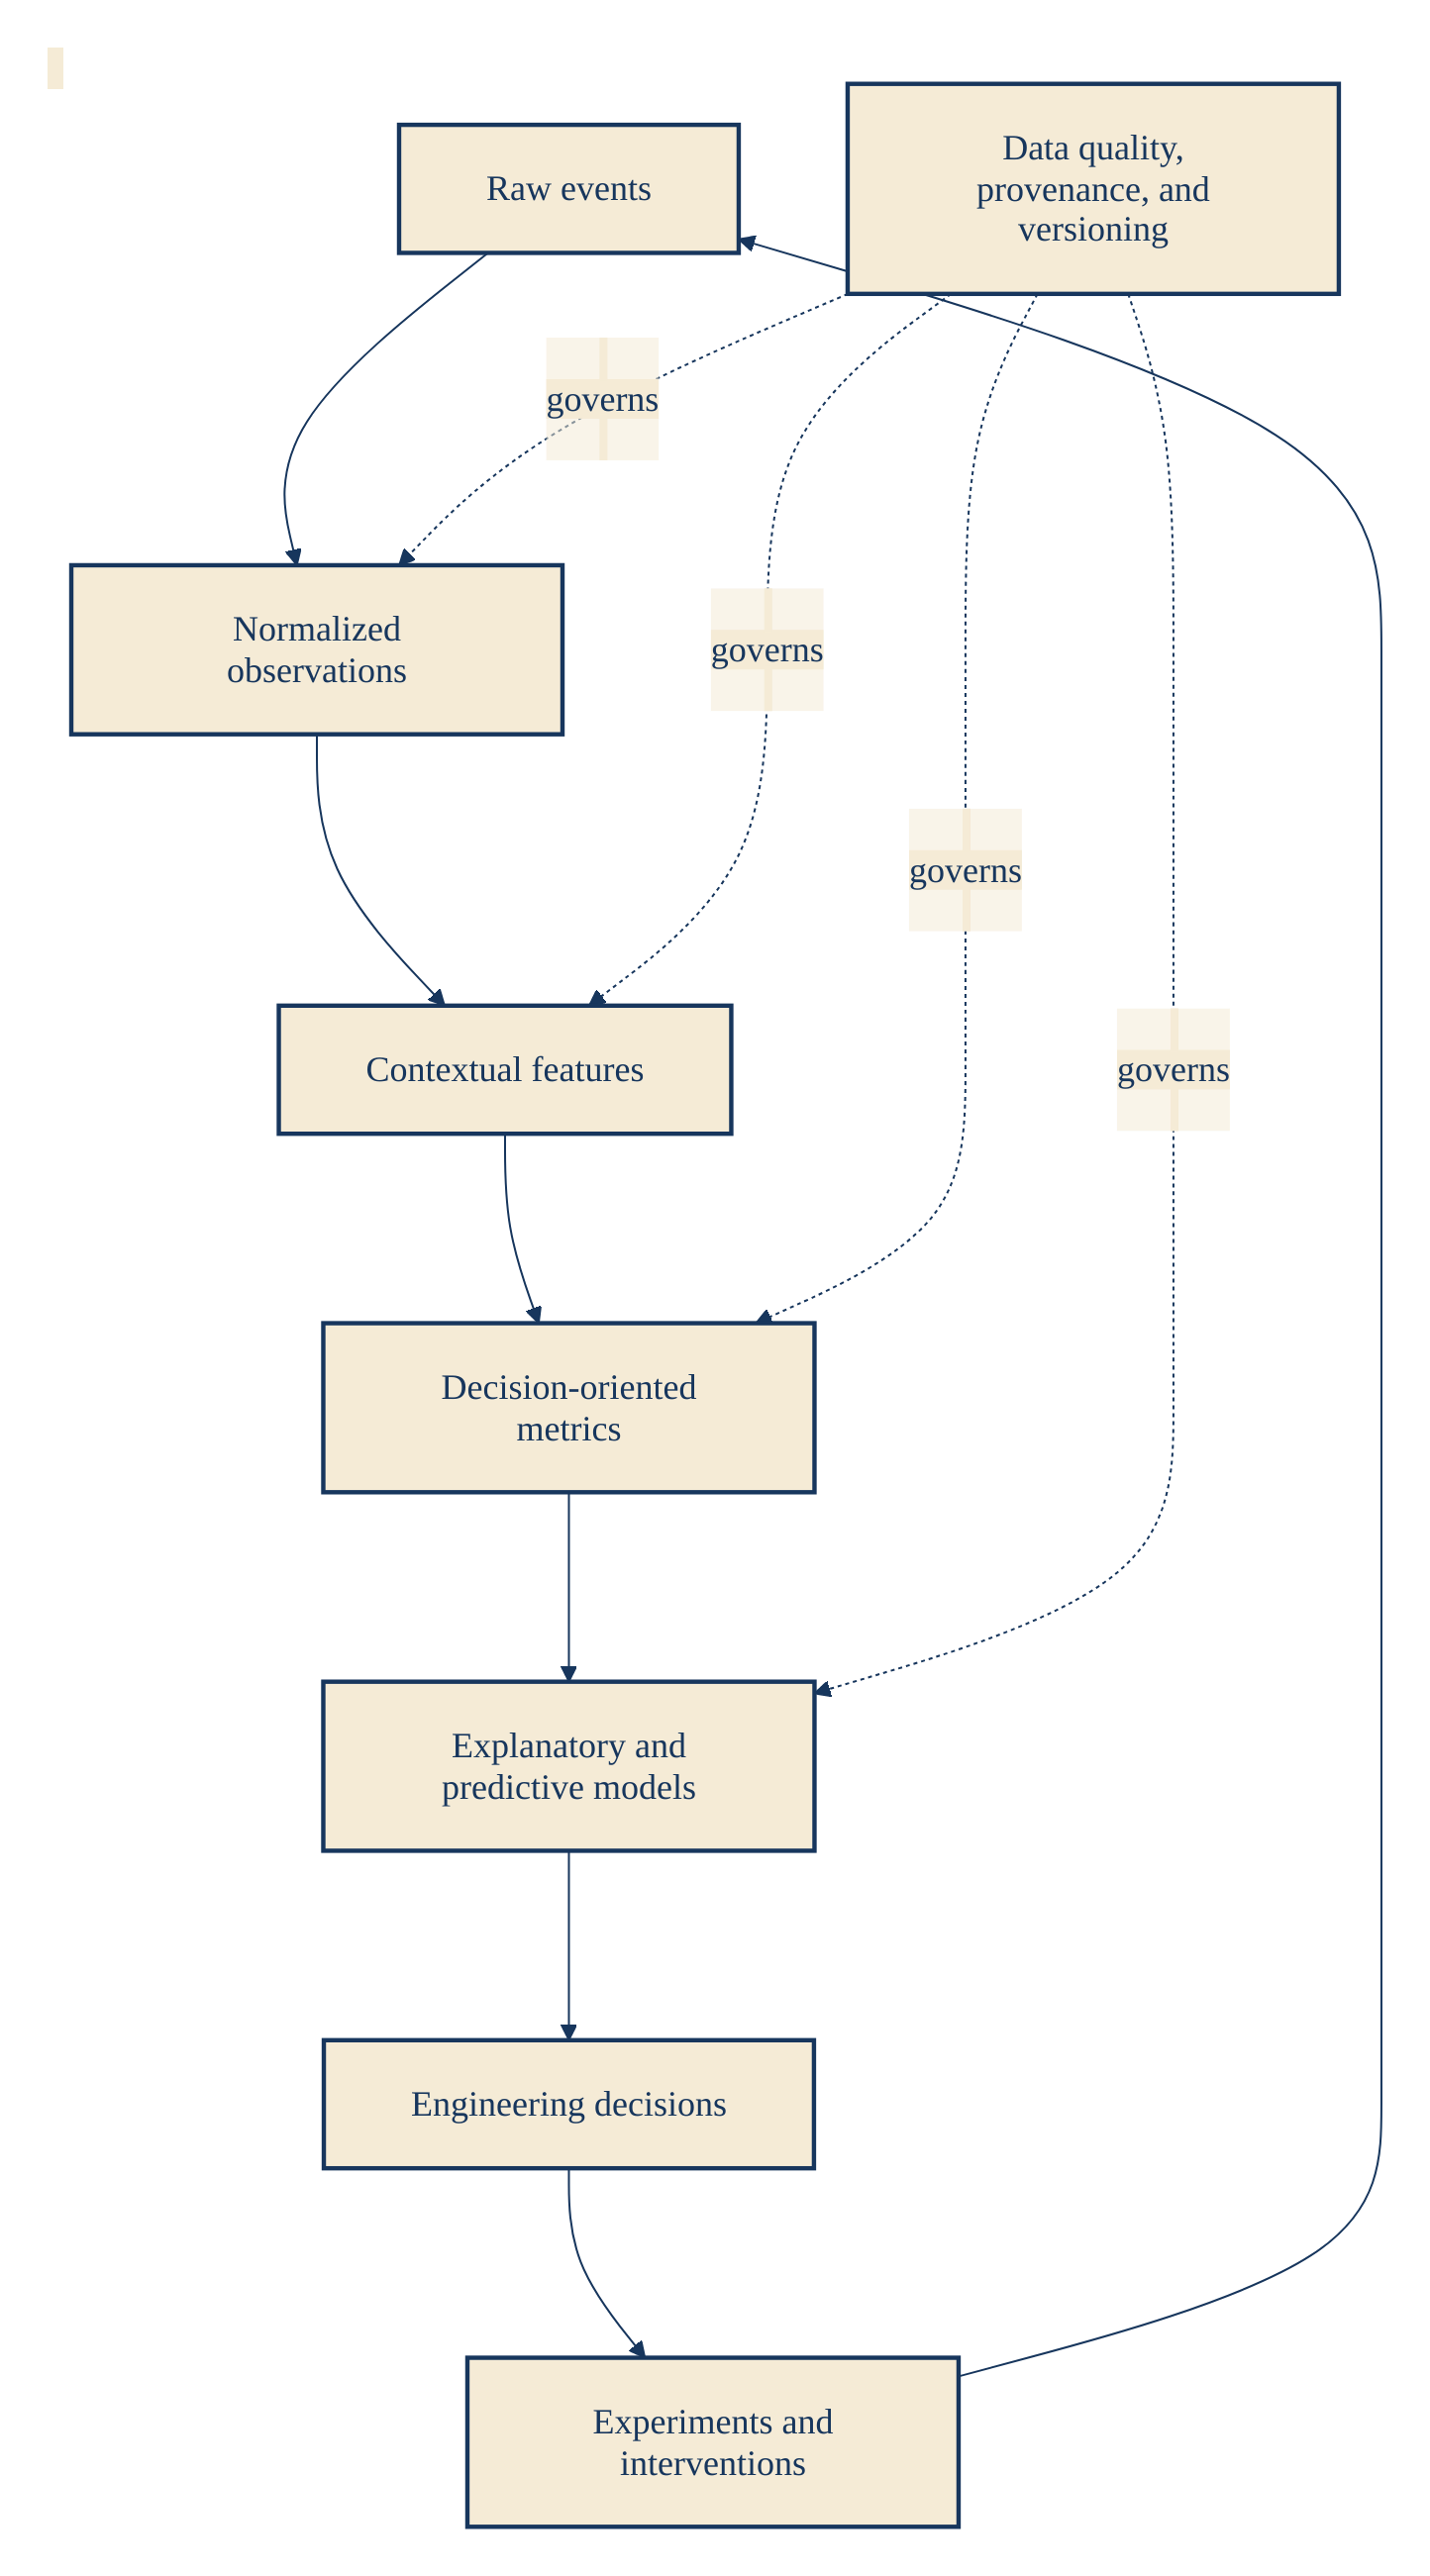
Measurement hierarchy

The five families a bundle should span

  1. Flow — lead time, queue time, WIP, aging, flow efficiency

  2. Quality — change failure rate, escaped defects, rework ratio, detection stage

  3. Cost — cost per accepted outcome, cost of delay, scarce-attention consumption

  4. Attention — cognitive reload, context recovery, validation burden

  5. Guardrails — accepted outcome rate, guardrail breach rate, data-quality state

Skip a family and you have picked a blind spot.

Anatomy of one metric in the bundle

Identifier / Version

stable name; semantic version of definition

Construct / Decision

what it measures; which decision it supports

Unit / Population

Engineering Change, PR, service, team — with exclusions

Formula / Sources

exact computation; events, entities, features, models

Uncertainty / Failure modes

quality state; how it misleads or is gamed

Guardrail / Owner

tolerance that must hold; accountable group

Retirement

date or condition at which this metric is reviewed

A metric that cannot fill these fields is not ready for the bundle.

The worked flow bundle — a warning

Three months post-workflow-change, every flow number improves:

Measure

Before

After

Lead time (days)

7.9

6.2

Review queue (days)

2.6

1.4

WIP

51

42

Flow efficiency

41%

50%

Accepted outcome rate

91%

87%

As isolated metrics: an unambiguous win.

As a bundle: the loudest signal is the four-point drop in accepted outcomes. Any single flow number would have hidden it.

Segment 1 — write the decision (15 min)

Pair up. In one sentence, write the decision the bundle must support.

Good examples:

  • "Should we mandate the AI reviewer for all repos?"

  • "Should we approve the migration from monorepo to polyrepo for the payments team?"

  • "Should we keep the mandatory two-reviewer policy for the platform team?"

Rule: if the sentence is longer than 20 words, the decision is not sharp enough.

Report back: swap sentences with the next pair — can they name the decision without asking a follow-up question?

The bundle template

A blank bundle for your decision:

  • Primary outcome — the metric that actually answers the decision

  • Diagnostics — one per family, to explain why the primary moved

  • Guardrails — what must not get worse for the decision to stand

  • Populations — which teams, repos, change classes are eligible

  • Owner — accountable group per metric

  • Retirement date — 90 days, or on decision, whichever comes first

Primary outcome — pick the estimand, not the vibe

The primary outcome is the metric that would flip your decision if it moved.

Not the metric that is easy. Not the metric already on a dashboard.

For "mandate the AI reviewer": is it severe escaped defects? Human validation burden? Cost per accepted outcome? Different primaries imply different mandates.

\[CPO = \frac{\sum_e C_{total}(e)}{N_{accepted\ outcomes}}\]

Only comparable within an outcome class.

Diagnostics — one per family

For "mandate the AI reviewer":

  • Flow — Engineering Change lead time, review queue time

  • Quality — escaped defect rate (severity-weighted); duplicate finding rate

  • Cost — cost per accepted outcome; AI + validation cost

  • Attention — human validation burden; cognitive reload

  • Guardrails — accepted outcome rate; guardrail breach rate

Each diagnostic has its own decision-role: explain, contextualise, or veto.

Segment 2 — draft the bundle (20 min)

For your decision from Segment 1, fill the template:

  1. One primary outcome metric — with formula

  2. One diagnostic per family — flow, quality, cost, attention

  3. Two or three guardrails with declared tolerances (e.g., accepted outcome rate must not drop more than 2 points)

  4. Populations — which teams, repos, change classes

  5. Owner — a named group per metric

  6. Retirement date

Constraint: the whole bundle fits on one page. If it doesn’t, cut.

Report back: which family was hardest to fill?

Goodhart drift, in a picture

Metric corruption cycle

When a measure becomes a target, it ceases to be a good measure.

The drift is predictable: metric published → attention allocated → behaviour adapts → construct decouples from measure → decision degrades.

How every metric gets gamed

  • Lead time — split changes into smaller PRs; move waiting outside the measured window

  • Change failure rate — reclassify hotfixes as planned work

  • Escaped defects — narrow the attribution window

  • Precision at k — tune k downward; deprioritise ambiguous findings

  • Cost per accepted outcome — accept more marginal outcomes

  • Accepted outcome rate — loosen acceptance criteria

The bundle catches gaming when one metric moves but its natural partner does not.

And every metric has a confounder

  • Lead time down — quieter release period; simpler changes; reviewer staffing shift

  • Escaped defects down — customer reporting friction increased

  • Validation burden down — teams stopped inspecting AI output

  • Flow efficiency up — fewer complex changes in the mix

  • Cost per outcome down — outcome classes are not comparable across the periods

Ask each metric: what would move you without the intervention?

Segment 3 — stress-test the bundle (25 min)

For each metric in your Segment 2 bundle:

  1. Name one way to game it in under a quarter

  2. Name one confounder that would move it without the intervention

  3. Identify which other metric in the bundle would catch each

If a metric has no partner in the bundle that would expose gaming or confounding, either add one — or admit the metric is unsafe alone.

Report back: the metric you decided to remove because you couldn’t defend it.

The report format — no single score

Executives ask for one number. The one number is the wrong number.

Report shape:

  • Decision, restated in one sentence

  • Primary outcome: value, uncertainty, guardrail state

  • Diagnostics table: one row per family, with drill-down link

  • Guardrails: green / amber / red, with tolerance shown

  • Data quality state: freshness, linkage coverage, replay divergence

  • Recommended action — including "wait" and "amend"

Segment 4 — write the report (15 min)

Draft the one-page exec report your bundle produces.

Rules:

  • No single composite score

  • Every number carries an uncertainty state

  • Every guardrail carries its declared tolerance

  • The recommended action must be reachable from the bundle

Then run the veto test: if the primary is green but a guardrail is red, does your report make the right call visible?

Report back: read your one page aloud in 60 seconds.

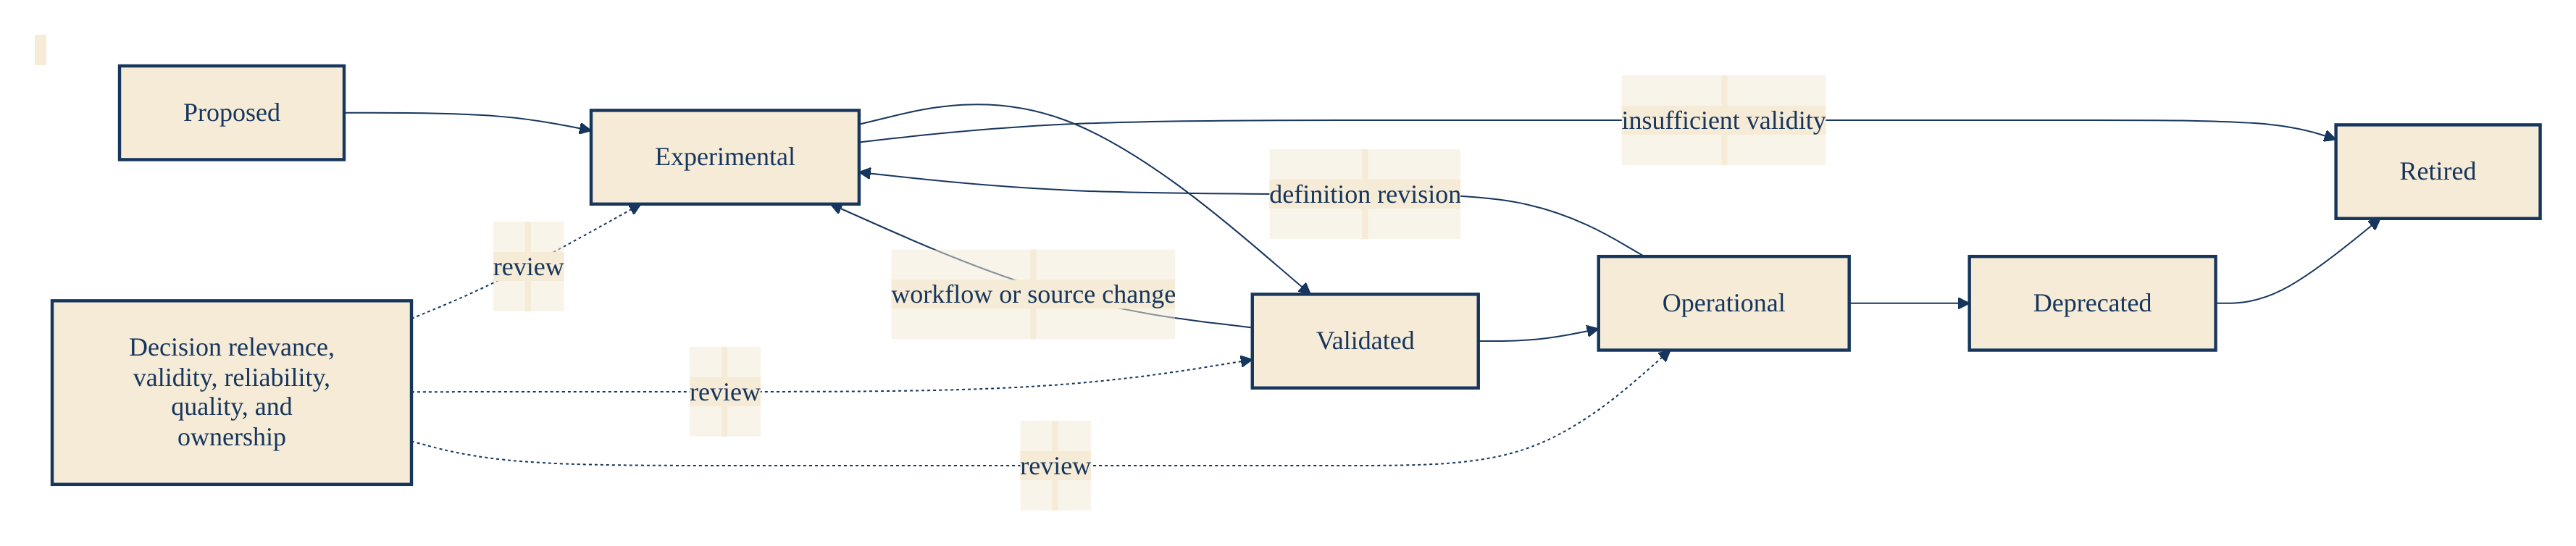
The metric lifecycle

Metric lifecycle

Proposed → Experimental → Validated → Operational → Deprecated → Retired.

  • A proposed metric does not belong in a decision bundle

  • An operational metric has owner, SLO, lineage, and action process

  • A metric that no longer moves a decision is retired, not preserved

Every metric in your bundle gets a state today.

Don’ts, worth memorising

  • Don’t put a proposed metric in an executive bundle

  • Don’t ship a composite that hides its components

  • Don’t publish a number without its data-quality state

  • Don’t attach a dollar value without listing assumptions

  • Don’t leave a metric without an owner or a retirement date

  • Don’t answer "are we improving?" with an average

Wrap-up

  • One decision, one sentence

  • One primary, several diagnostics, guardrails on every side

  • Every metric owned, populated, versioned, retired

  • No single score presented to the exec

  • Come back in 90 days and retire what didn’t change a decision

Read: Chapter 11 of Engineering Intelligence. Do: one bundle per Class-2 decision you are actually making this quarter.

A bundle is the smallest unit of governed evidence.