build: 2026-10-19 20:32 UTC

Writing a Metric Specification


Writing a Metric Specification

A hands-on workshop derived from Chapter 5 and Appendix B of Engineering Intelligence.

90 minutes · 4 hands-on segments · paper exercises

Learning outcomes

By the end of this workshop you can:

  • Draft a governed metric specification — purpose, definition, instrumentation, uncertainty, guardrails, retirement

  • Critique a real dashboard metric against the standard and name what it lacks

  • Retire a metric responsibly — with a version, a reason, and a successor

You leave with a signed spec draft for one metric your team will actually adopt.

The problem

An organisation you have worked in. Three portfolios. Forty-two dashboards. Two hundred and twelve tiles.

  • Every tile has a name. Almost none has a definition.

  • No tile has an owner who could tell you what decision it informs

  • No tile has a version. Historical trend lines mean whatever the current query means

  • No tile has a retirement criterion. Nothing has ever been removed

This is telemetry accumulation, not measurement.

A metric name is not a definition

Cycle time. Productivity. Review effort. Deployment frequency. Quality. Acceptance rate. AI effectiveness.

Two teams publishing "the same" metric can differ on:

  • unit of analysis · start and end events · eligible population

  • missing data · bots and AI · aggregation · time zone

  • outlier handling · complexity adjustment · outcome window

The specification is the artefact that makes those choices explicit and reviewable.

The measurement hierarchy

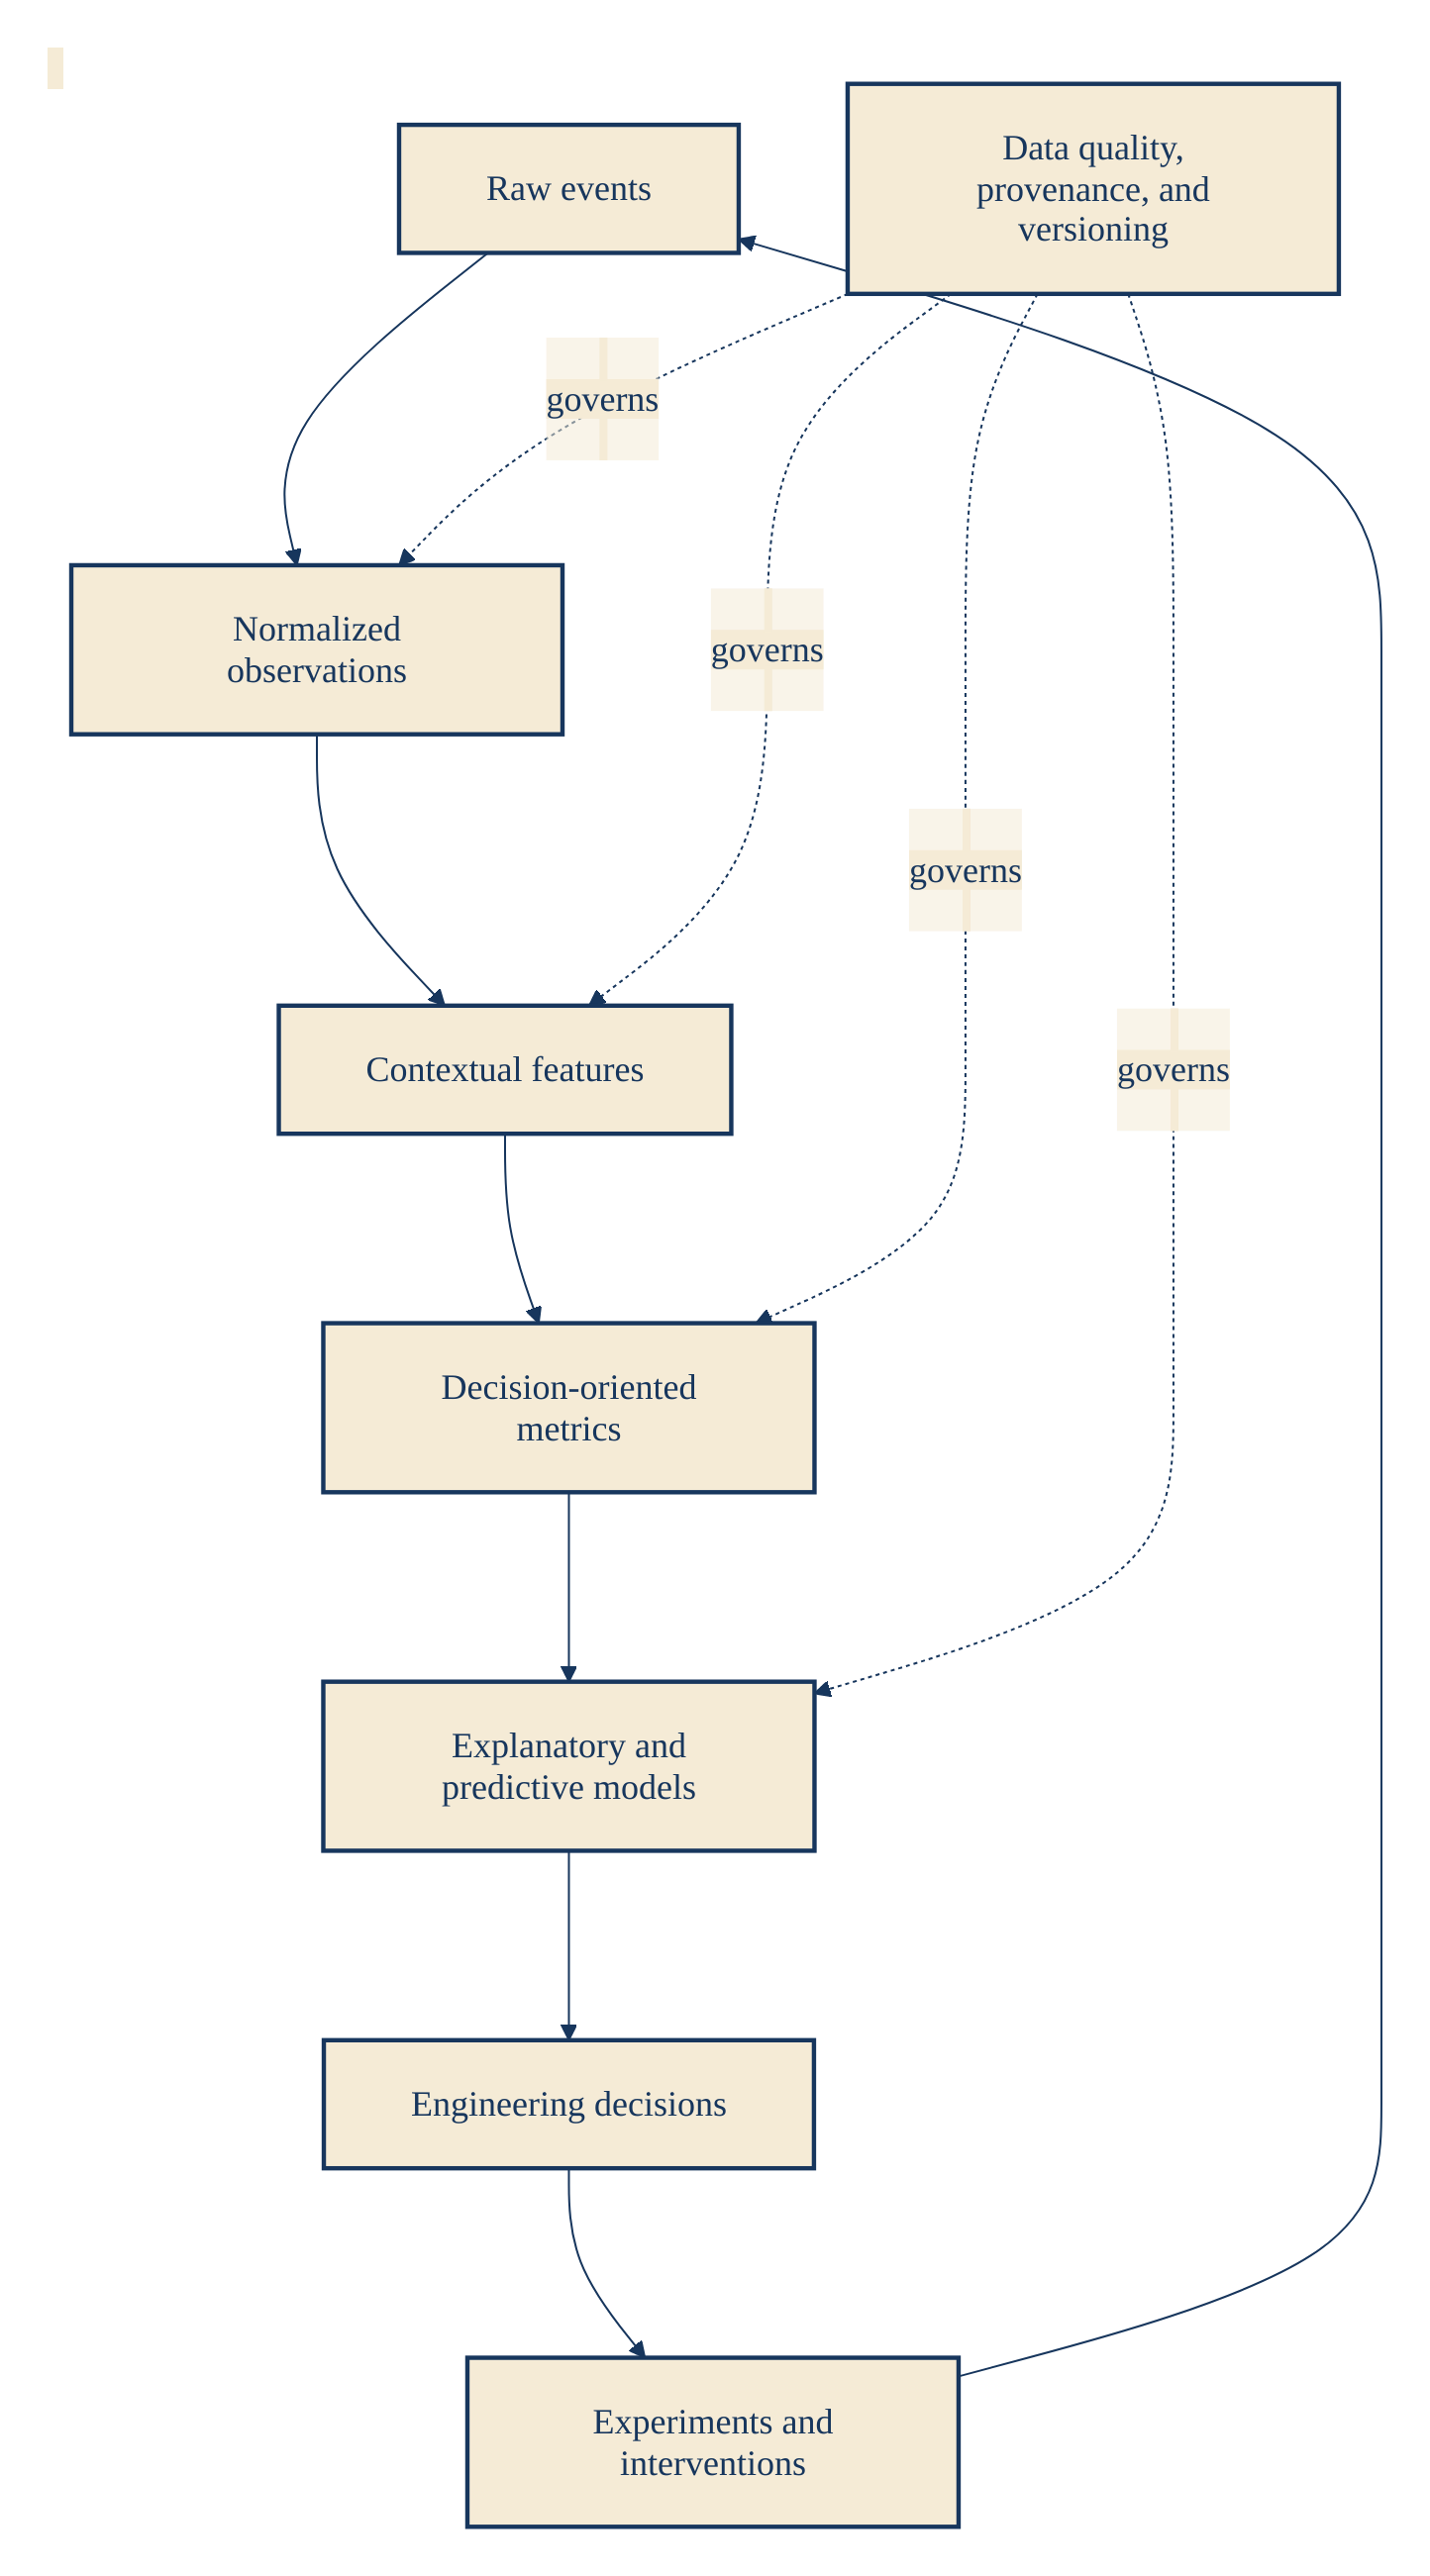
Engineering measurement hierarchy

Events → observations → features → metric → models → decisions.

A metric only exists at layer 4. Everything below is raw material; everything above is what it’s for.

The four governing questions

Every governed metric answers:

  1. What decision is this metric intended to support?

  2. What construct does it represent?

  3. How is it computed from evidence?

  4. Under what conditions should it not be used?

A metric that cannot answer these four should remain exploratory. It does not belong on a dashboard, in an experiment, in a procurement case, or in a policy.

The specification lifecycle

Metric specification lifecycle

Proposal → design → validation → approval → publication → monitoring → revision → deprecation → retirement.

The workshop today drafts proposal and design. Validation and approval happen back at your organisation.

Segment 1 (15 min)

Pick a metric. Write the purpose — the decision it informs.

Pair up. Pick one metric currently on a dashboard your team looks at (not a hypothetical — this is the metric you’ll take back and adopt). One partner has skin in the game; the other asks hard questions.

On paper, write:

  • Decision: the choice this metric changes

  • User: who acts on it

  • Action: what they would do differently if the value moved

  • Threshold: at what value the action becomes justified

If you cannot name a decision, mark the metric for retirement. Move to your second choice.

Report back: one metric your pair marked for retirement.

Weak vs strong purpose

Weak: "Track review productivity."
Strong: "Estimate the human attention consumed by pull-request validation, so that review-routing and AI-review interventions can be evaluated economically."

The strong version names the user, the decision, and the action. The weak version is a category label.

Segment 2 (20 min)

Definition — precise enough that two implementors compute the same number.

Write:

  • Construct — the concept, independent of instrumentation

  • Unit of analysis — Engineering Change, PR, deployment, incident, actor-day

  • Population — includes, excludes, minimum evidence quality

  • Numerator and denominator — for rates and ratios, both explicit

  • Filters — bots, drafts, time zone, business hours, late events

Test: hand your definition to another pair. Would they compute the same number? If not, tighten.

Review latency — a worked contrast

Weak: "Time from pull-request open to first review."

Strong specification names:

  • business time vs wall clock

  • draft exclusion

  • bot reviews

  • reviewer assignment vs self-review

  • reopened pull requests

  • time zones

  • unit — pull request or Engineering Change

Same phrase. Materially different numbers.

Formula and aggregation

Every ratio needs both parts:

\[FindingAcceptanceRate = \frac{\text{AcceptedUniqueFindings}}{\text{EligibleUniqueFindings}}\]

Decide, on paper:

  • Are duplicates removed?

  • Are unresolved findings included?

  • Severity-weighted, or raw counts?

  • What happens when the denominator is zero?

Aggregation matters. Medians cannot be averaged safely across teams. Declare whether your metric is additive.

Segment 3 (25 min)

Instrumentation, interpretation, failure modes.

For your metric, write:

  • Source events and entities — what evidence is required

  • Data-quality thresholds — freshness, completeness, linkage

  • Missing-data policy — not-observed vs true-zero vs excluded

  • Bot / AI / human treatment — never combined silently

  • Interpretation — what a high or low value might mean, with alternatives

  • Prohibited uses — ranking, cross-team without adjustment, causal claims from descriptive movement

  • Failure modes — what could game it, what could bias it, what mechanism moves it without meaning

The corruption cycle — name the games

How well-meaning metrics corrupt

Published → target set → behaviour distorts → number moves without construct moving → decisions made on a hollowed-out number.

Plausible gaming to declare before publication:

  • splitting changes to reduce apparent size · delaying status transitions

  • avoiding difficult work · producing low-value findings to lift a count

  • suppressing incident linkage · moving work outside instrumented systems

The metric owner monitors for these effects, not just names them.

Uncertainty — no bare point estimates

Every inferential or sampled metric requires an uncertainty method:

  • confidence or credible intervals

  • bootstrap intervals · standard errors

  • control limits · posterior distributions

  • sensitivity ranges

Small populations displayed with false precision cause more damage than no metric at all.

Choose one method for your metric. Note the assumption it makes.

Segment 4 (15 min)

Governance — what makes the metric survive contact with an organisation.

Fill in:

  • Owner — accountable individual, not a team mailbox

  • Version — semantic; start at 1.0.0 for design

  • Uncertainty range — method and level

  • Guardrails — the outcomes that must not worsen

  • Review cadence — quarterly, or on trigger

  • Retirement criterion — the condition under which this metric goes away

Guardrails — never optimise alone

An AI-review evaluation targets lower human review effort.

Its declared guardrails might include:

  • severe defect rate

  • rollback rate

  • security findings

  • human validation effort at the tail

  • author misunderstanding

  • long-term reviewer disengagement

A change is beneficial only when the primary outcome improves and every guardrail stays within its predeclared tolerance.

Retirement is a first-class action

Retirement criteria may include:

  • no active decision use

  • construct no longer valid

  • source semantics changed

  • persistent behavioural distortion

  • replacement by a better measure

  • maintenance cost exceeds value

Retired metrics remain discoverable — with a reason and a successor where one exists. This is what keeps the catalogue honest as it grows.

The signed v1.0.0 draft

By now each pair holds a paper spec containing:

  • identity — id, name, version, owner, review dates

  • purpose — decision, user, action, threshold

  • definition — construct, unit, population, formula, filters

  • instrumentation — sources, quality gates, missing-data policy

  • interpretation and prohibited uses

  • uncertainty method

  • guardrails and retirement criterion

Sign it. Both partners. Date it. It is now v1.0.0.

Anti-patterns to reject on Monday

  • Formula-only definition — construct and interpretation left ambiguous

  • Metric without population — eligibility changes read as system performance

  • Missing equals zero — source outages look like improvement

  • Versionless dashboard — silent semantic drift

  • Universal threshold — one boundary across incompatible risk profiles

  • Bare point estimate — noise displayed as fact

  • Individual ranking by system telemetry — corrupts behaviour, damages trust

  • Metric without retirement — obsolete measures never leave

What you go home with

Each pair takes back:

  • a signed v1.0.0 spec for one real metric

  • a shortlist of metrics you marked for retirement

  • a set of guardrails to declare alongside anything you’re already optimising

  • a review date — 90 days out — to bring the metric back for validation

Reading and running

  • Read: Chapter 5 — Measuring Engineering Systems

  • Read: Appendix B — Metric Specification Standard

  • Read: Chapter 11 — Engineering Metrics Catalogue, for exemplar specifications you can pattern-match against

  • Bring back in 90 days: the metric spec, the decision it changed, and the metric you retired

Thank you

Reconvene in 90 days.

Bring the spec you shipped. Bring the metric you retired. Bring the decision the spec informed — and the decision it did not.

That is what a governed metric catalogue is for.