Article
Building SolarSage: a local-first solar monitoring tool
A local-first monitor for an off-grid 15 kW solar system that forecasts surplus power from the weather and tells you when to run heavy loads.
I have an off-grid in San Felipe, Mexico, with a 15 kW EG4 solar system and a wall of lithium batteries. When the grid isn’t there, “do I have enough power to run the AC tonight?” stops being abstract. The vendor dashboard at monitor.eg4electronics.com shows live numbers and a few canned charts, but it doesn’t predict anything. I wanted a tool that did.
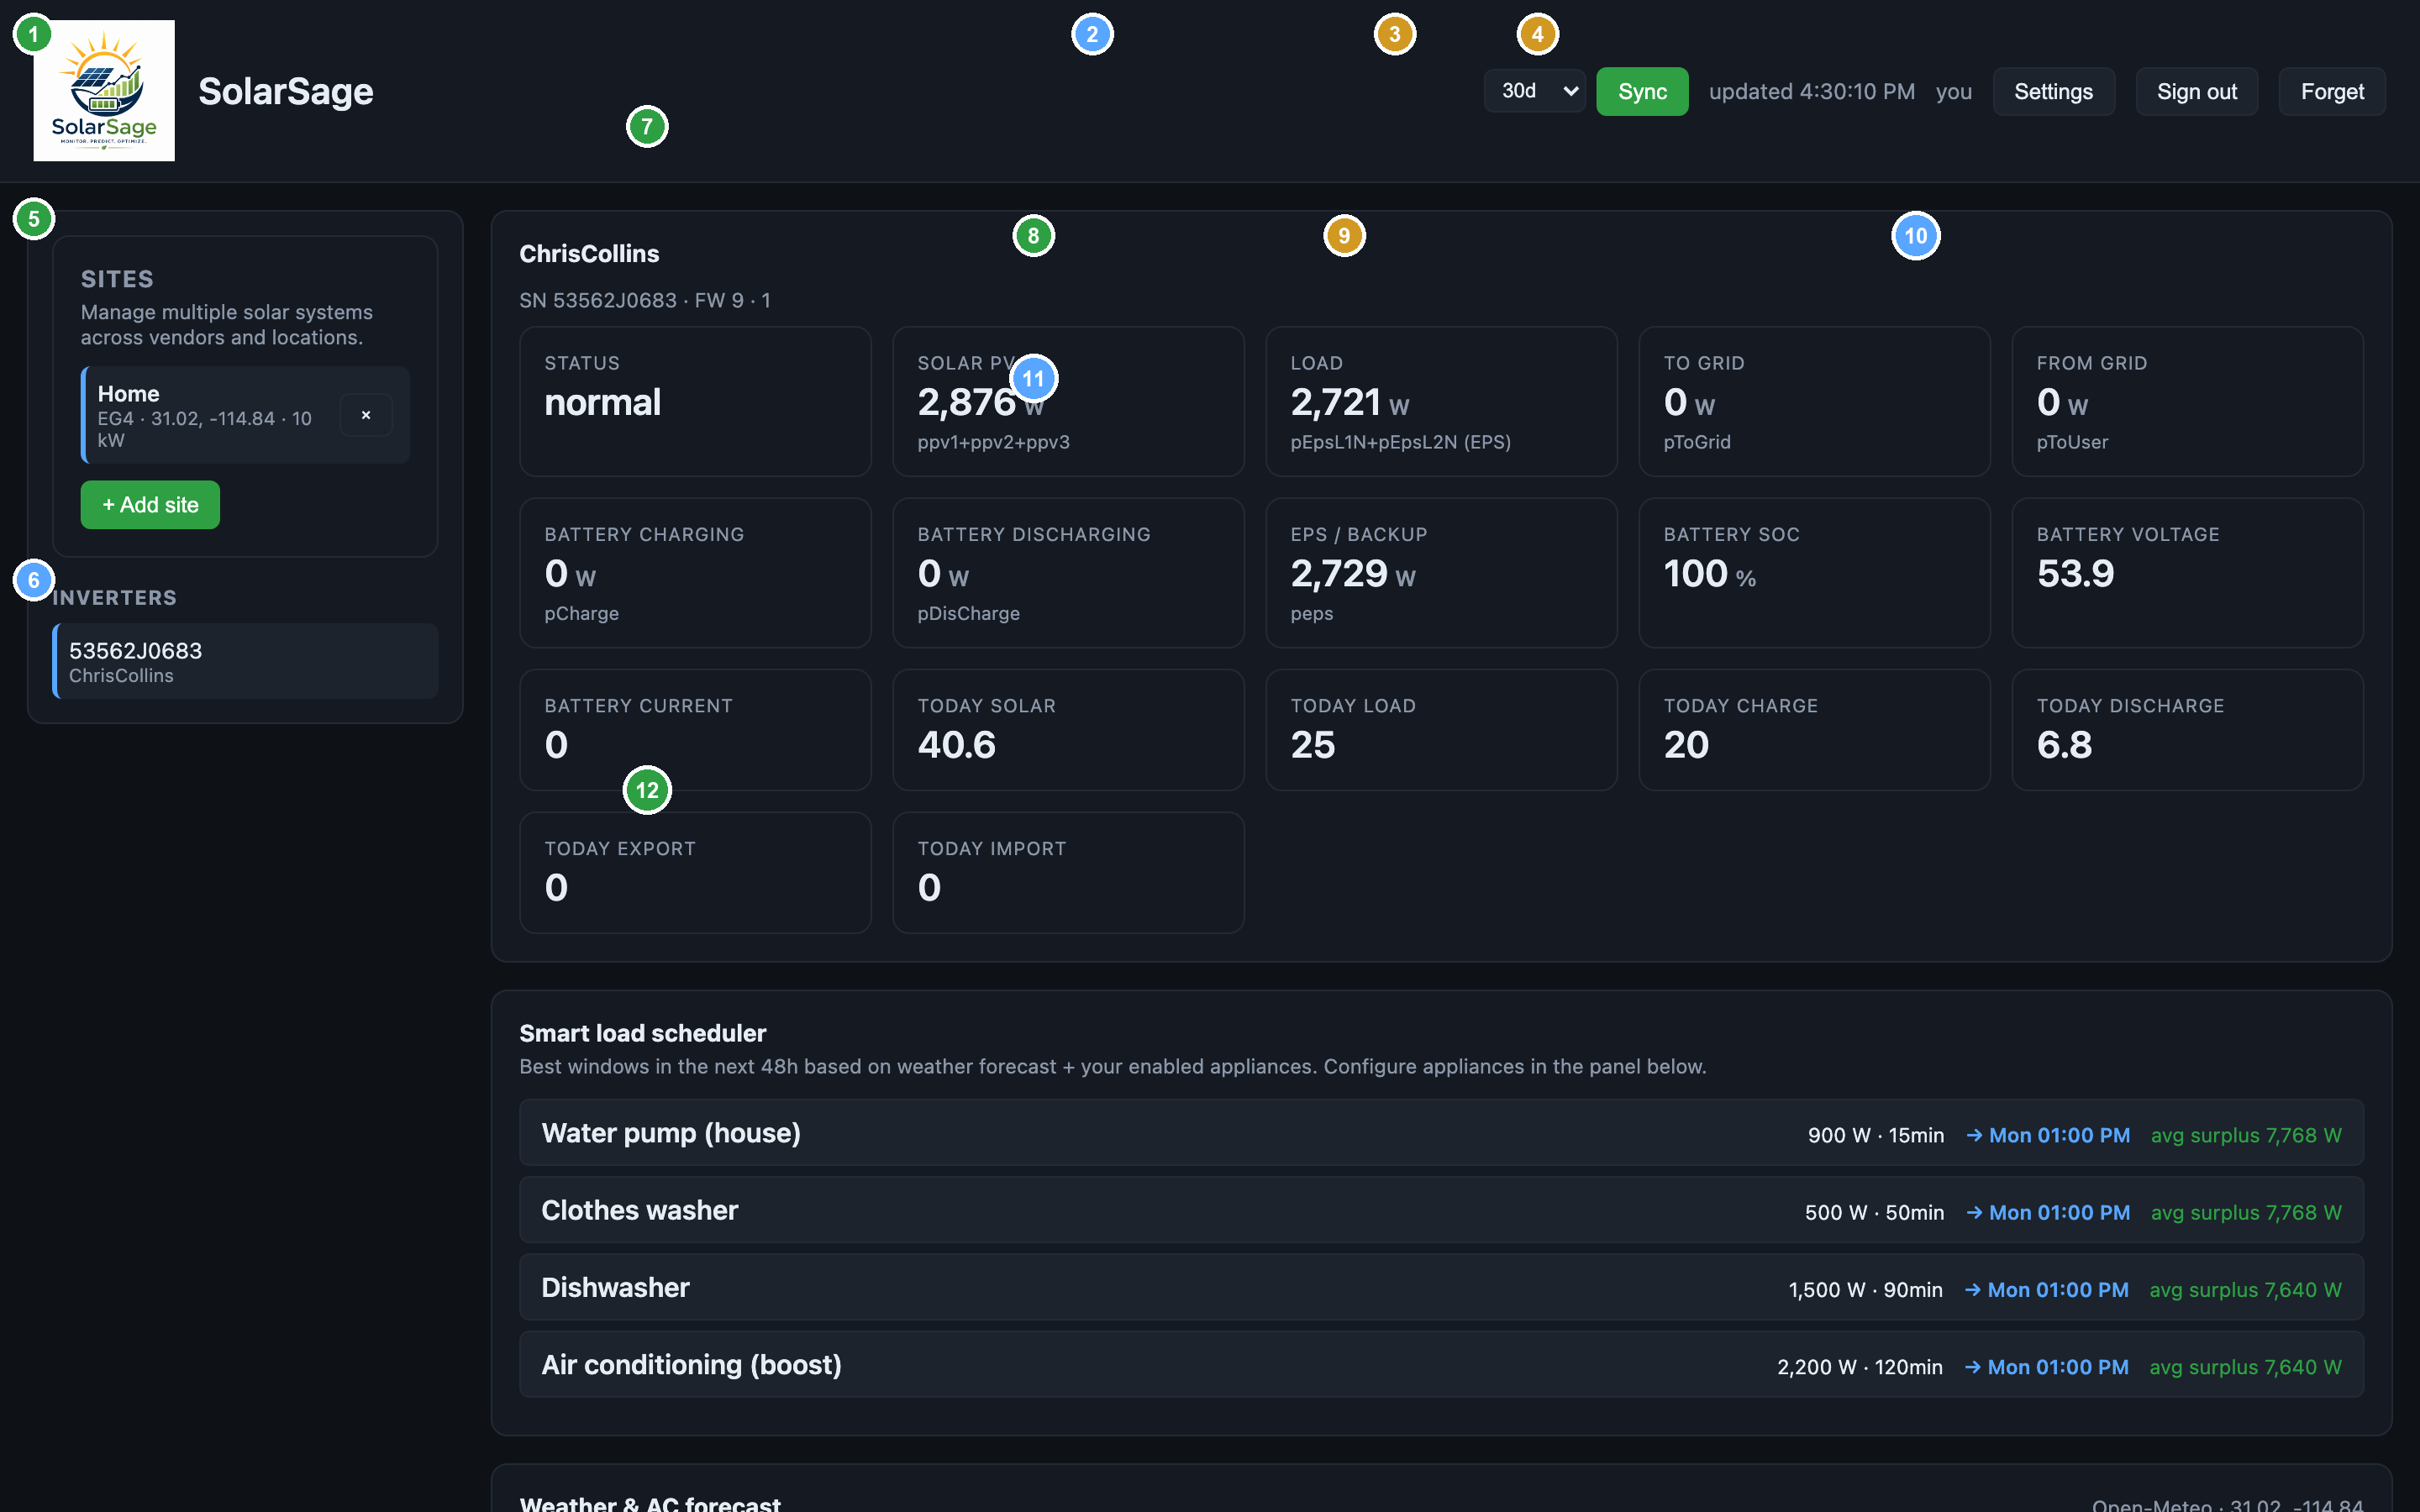
So I built SolarSage — a local monitor that polls my system every minute, captures everything in SQLite, layers a weather-aware forecast on top, and turns “you’ll have surplus solar” into “run the water heater between 12 and 3 PM tomorrow.” It runs entirely on my laptop, with no cloud component and nothing leaving my network.
The bigger goal is intelligence: predicting how much energy I’ll produce, how much the AC will draw at any given outdoor temperature, and where the headroom is. Off-grid living rewards that kind of forecasting in a way grid-tied living doesn’t — if you guess wrong, you run out, or you run a generator.
What it does
The architecture is intentionally boring: a FastAPI backend polls the EG4 portal every 60 seconds and writes every numeric field to a SQLite database. A small React UI reads from the backend. Forecasts and analytics layer on top. Everything runs on 127.0.0.1; no cloud, no telemetry, no signup. Credentials live in a 0600 file on my laptop and that’s it.
The interesting parts are the things that surprised me on the way.
1. EG4 has no public API — but it has chart endpoints
The official “API documentation” page is marketing. What the portal actually has is a set of undocumented JSON endpoints that power the web UI. After some reverse-engineering (and reading other people’s work), I found that /WManage/api/analyze/chart/dayLine with attr=ppv1 returns full-day timeseries for any attribute — but only some attributes work, and they vary by firmware. On my SNA-US 15K, ppv as a chart attr returns empty; I have to sum ppv1+ppv2+ppv3 myself. The “all channels at once” endpoint other libraries use (dayMultiLineParallel) returns data: [] entirely on this firmware.
The real gotcha: the chart endpoint’s month field is Java zero-indexed. May = 4. I caught it because timestamps came out exactly one month off — a great way to lose an afternoon if you trust the field names.
2. Free weather is finally great for solar
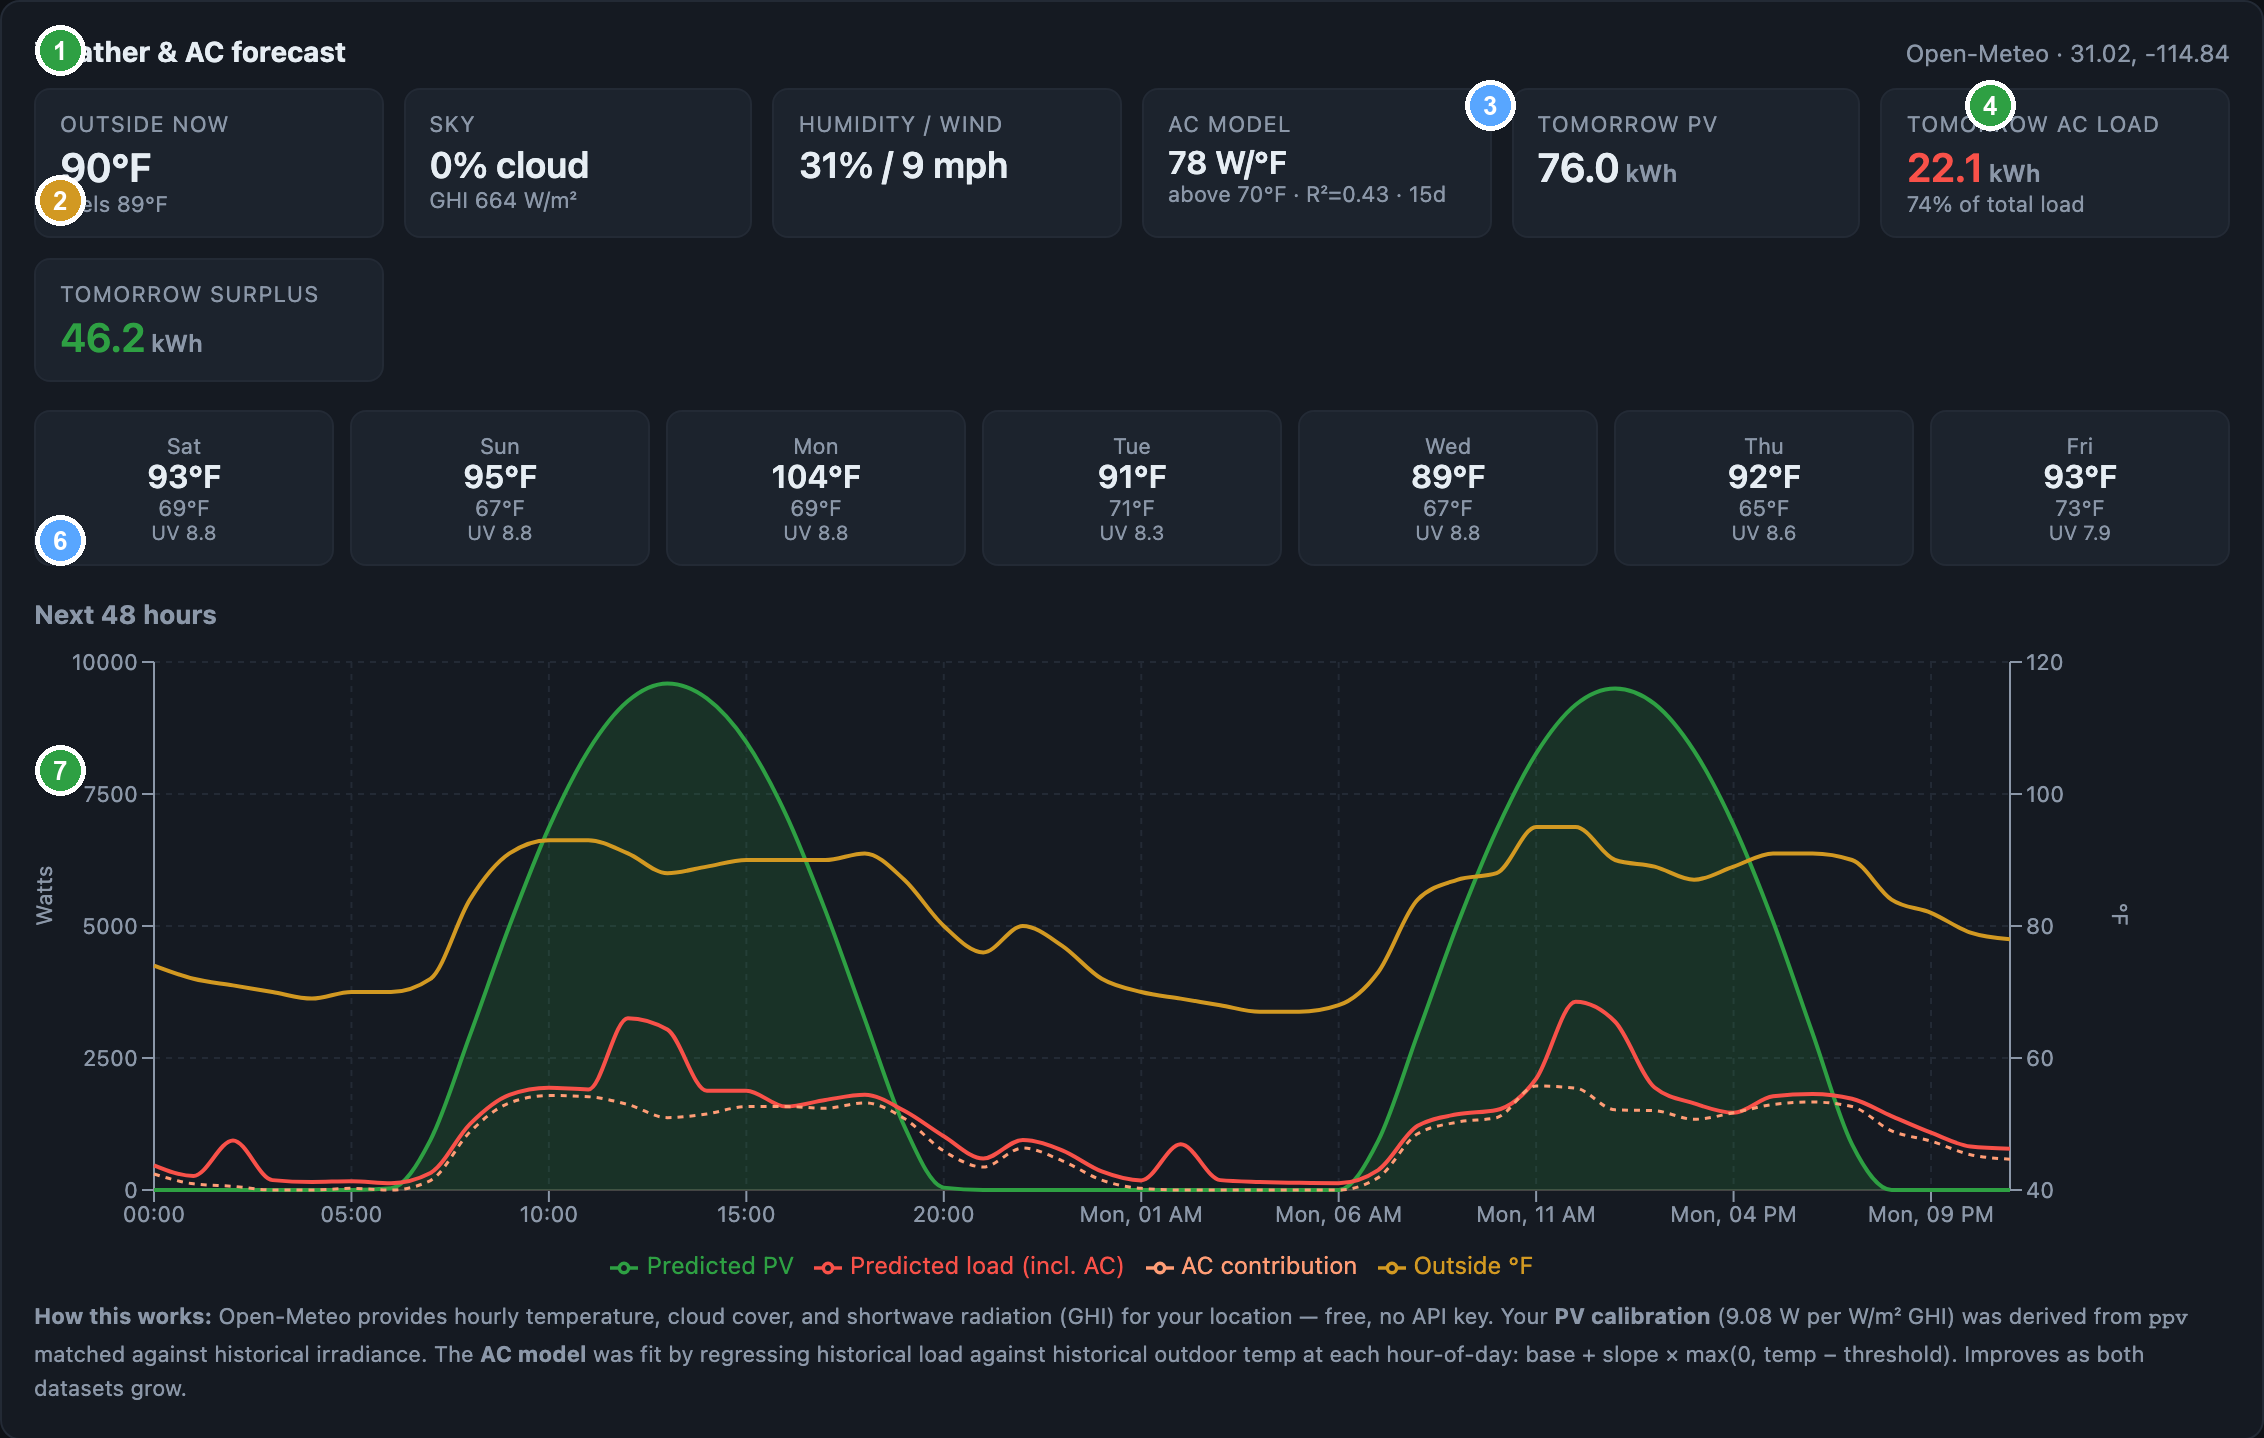
Open-Meteo is the only free, keyless weather service I’ve found that returns forecasted shortwave irradiance (GHI), not just cloud cover. That changes the modeling. Instead of estimating PV from “30% clouds”, I multiply the forecast GHI by my system’s measured W-per-W/m² calibration (about 9.08 for my install) and get tomorrow’s predicted PV curve hour by hour. The historical archive endpoint lets me back-fit other models too.
3. The AC model is one line of math
My biggest variable load is air conditioning, and AC tracks outdoor temperature almost linearly above the comfort threshold. SolarSage fits a cooling-degree model from joint Open-Meteo + load history:
load(hour) = base(hour) + slope_W_per_°F · max(0, °F − threshold)
Grid-search the threshold from 50°F to 90°F, OLS-fit the slope on the residual. After 15 days of data my model lands at threshold=71°F, slope=78 W/°F, R²=0.43. Not yet impressive — but better than the constant-load assumption every other tool uses, and it sharpens automatically as more days accumulate.
4. The dashboard already caught something
The string-health panel watches each PV string’s daily ratio against the strongest. Within hours of finishing it, the panel flagged ppv3 = 0% across every day. Either I have an unused third string (likely), or a fuse blew, or there’s a wiring fault. Either way, the alert came from the system itself — exactly the kind of slow drift the EG4 portal hides in plain sight.
5. Forecasts → concrete recommendations
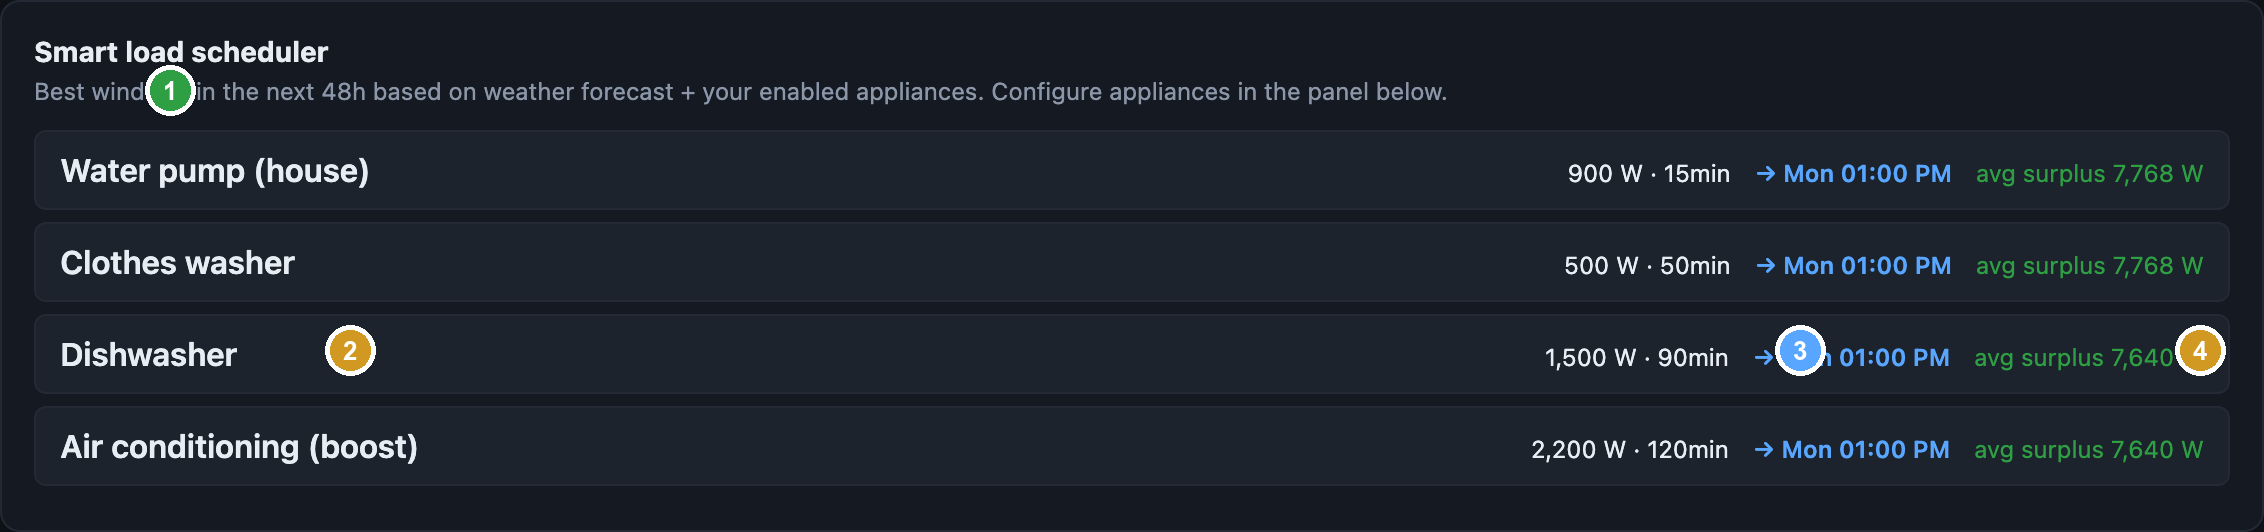
The “smart load scheduler” turns the surplus forecast into actionable windows: for each enabled appliance, scan the next 48 hours for a slot where every hour clears the appliance’s watts — not just the average. Right now it’s telling me to run the water heater + EV charger + dishwasher all in the same 12-15:00 block tomorrow, because that’s where 7.7 kW of sustained surplus lives. Pool pump is disabled because I don’t have one; electric dryer is disabled because mine’s gas. The scheduler respects what I told it I actually have.
Try it
Source is at github.com/geekychris/solarsage. The one-liner install is:
curl -fsSL https://raw.githubusercontent.com/geekychris/solarsage/main/install.sh | bash
It runs on macOS, Linux, and Windows. The architecture doc has Mermaid diagrams of the data flow; the installation doc has manual steps if you’d rather not curl | bash. The Q.Cells adapter is stubbed pending information on which monitoring portal Q.Cells installs actually talk to — drop me a note if you have one.